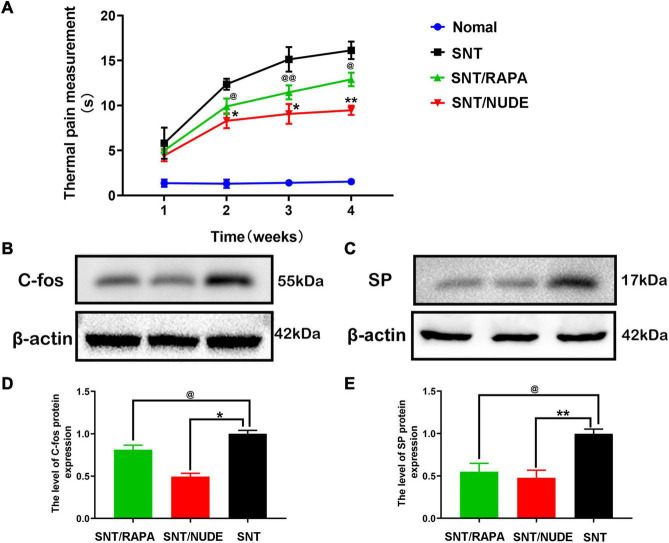
FIGURE 7.
Results of thermal pain measurement and expression of pain-related proteins c-fos and SP. (A) Weekly thermal pain response time measurement results. Except for the first week, the thermal pain response time between the SNT group and the other two groups was statistically different at all time points (*p < 0.05, **p < 0.01, @p < 0.05 @ @p < 0.01). (B,D) The expression result of c-fos in the spinal cord. As a pain marker, the expression of c-fos in the L4 lumbar spinal cord DRG was lower in the SNT/RAPA group than in the SNT group (@p < 0.05), and the expression in the SNT/NUDE group was significantly lower than that in the SNT group (*p < 0.05). (C,E) The result of the expression of substance p in the nerve stump. The content of substance p in the SNT group was significantly higher than the other two experimental groups (@p < 0.05, **p < 0.01).

