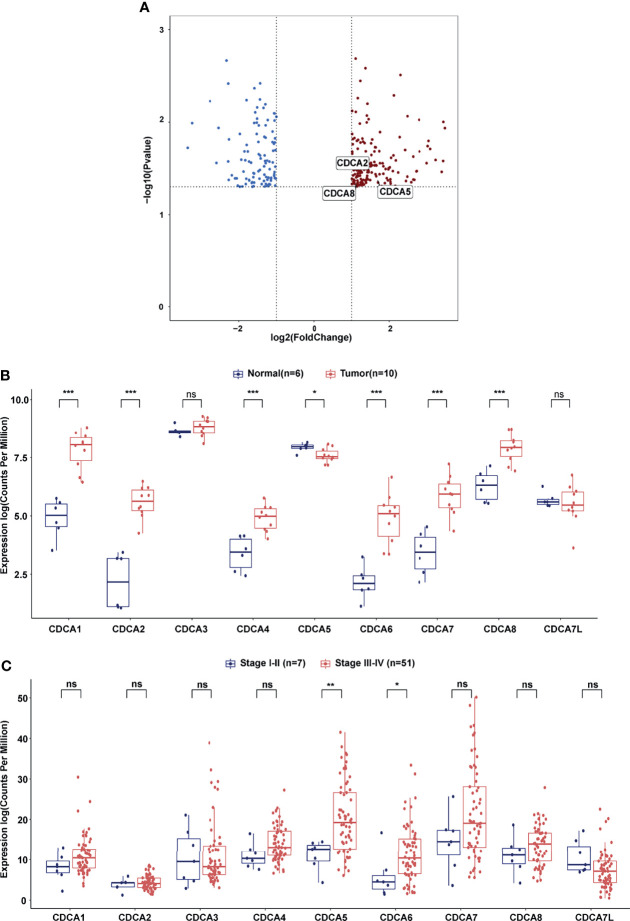
Figure 1.
CDCA gene family members expression analysis. (A) Volcano plot of differentially expressed genes between NPC samples and nasopharyngitis samples. The blue dot represents downregulated genes and the red dot represents upregulated genes. (B) Differential expression of CDCA gene family members between NPC tissues and nasopharyngitis tissues in GSE61218. (C) Differential expression of CDCA gene family members between NPC patients in stage I–II and NPC patients in stage III–IV in GSE102349. “*” represents p < 0.05, “**” represents p < 0.01, “***” represents p < 0.001, “ns” represents no significant difference.

