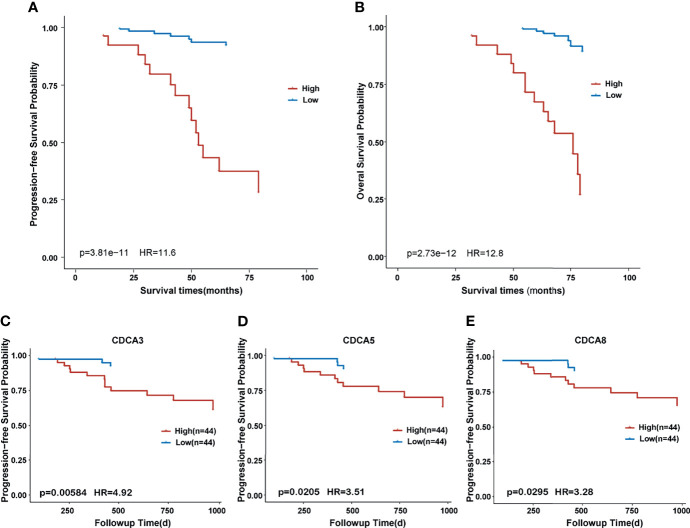
Figure 3.
Kaplan–Meier survival curve between different expression groups of CDCA gene family members. (A) Survival curve of progression-free survival in high and low expression of CDCA8 in our cohort. (B) Survival curve of overall survival in high and low expression of CDCA8 in our cohort. (C) Survival curve of progression-free survival in high and low expression of CDCA3 in the GSE102349 cohort. (D) Survival curve of progression-free survival in high and low expression of CDCA5 in the GSE102349 cohort. (E) Survival curve of progression-free survival in high and low expression of CDCA8 in the GSE102349 cohort.

