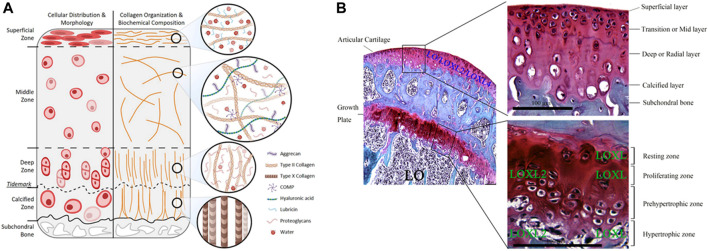
FIGURE 2.
Schematic representation and histological images of osteochondral structures. (A) Schematic representation of articular cartilage and the gradient distribution structure. Reproduced with permission (Thorp et al., 2021). Copyright: ©2021 by the authors. (B) Safranin O-Fast Green staining shows the different expression of LO, LOXL and LOXL2 (scale bar = 100 µm). Lysyl oxidase: LO; lysyl oxidase like-2: LOXL2; Lysyl oxidase-like enzymes: LOXL. Reproduced with permission (Lin et al., 2020). Copyright: ©2020 Lin, Xu, and Li.

