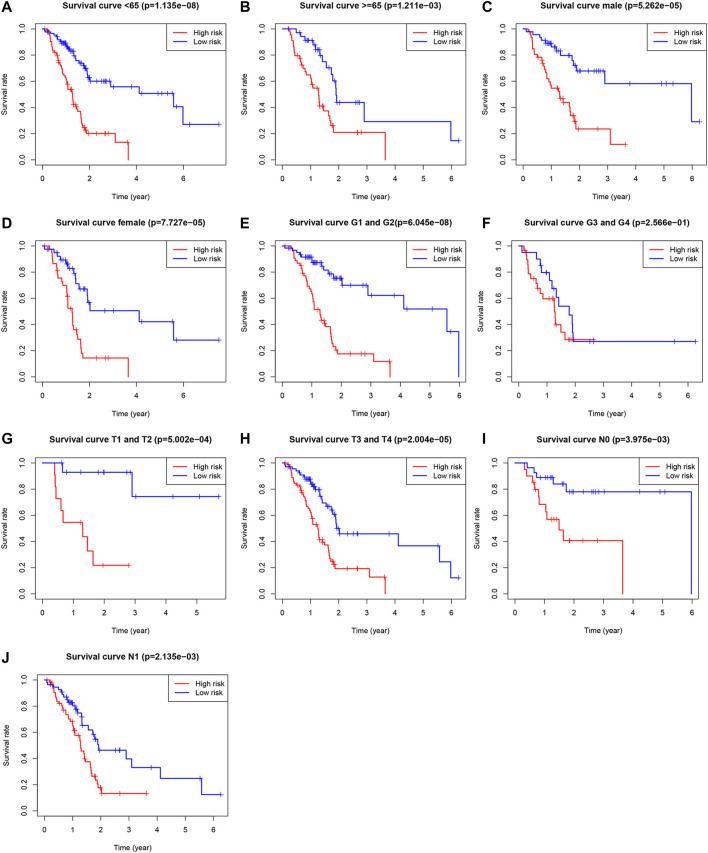
FIGURE 6.
Survival rates of PAAD patients with high- and low-risk patients with PAAD in the subgroups based on clinicopathological characteristics. (A) Subgroup of age <65 years. (B) Subgroup of age ≥65 years. (C) Male subgroup. (D) Female subgroup. (E) G1 and G2 subgroups. (F) G3 and G4 subgroups. (G) T1 and T2 subgroups. (H) T3 and T4 subgroups. (I) N0 subgroup. (J) N1 subgroup.

