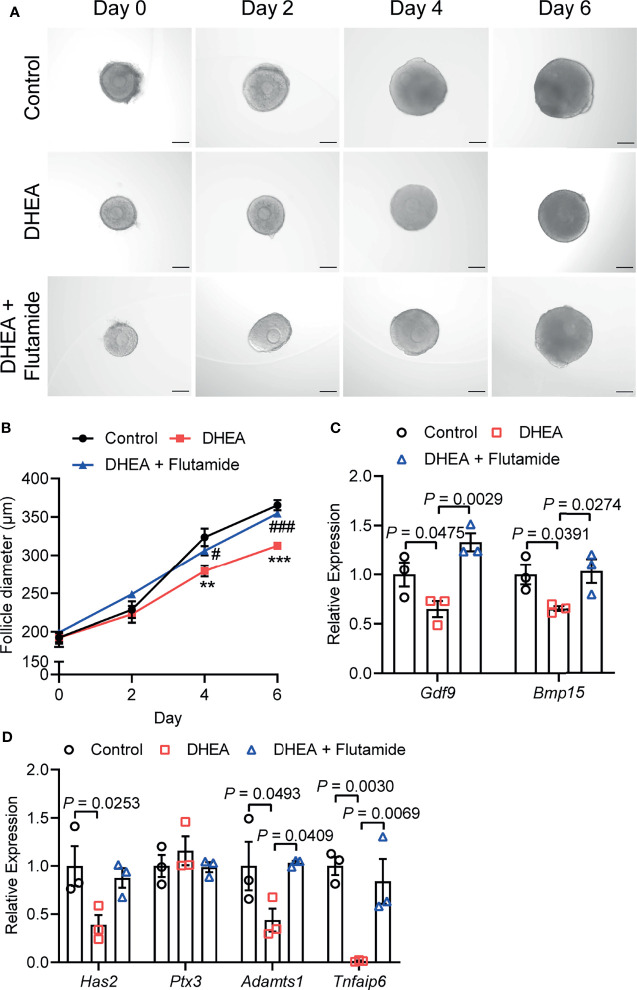
Figure 5.
Flutamide reversed DHEA-induced impairment of mouse follicular growth and ovulation in vitro. (A) Representative micrograph of mouse follicles cultured in vitro. (B) Follicle diameters in control, DHEA and DHEA + Flutamide group, N = 7. **P < 0.01, ***P < 0.001 versus Control; #P < 0.05, ###P < 0.001 versus DHEA. (C) mRNA expression levels of Gdf9, Bmp15 and (D) Has2, Ptx3, Tnfaip6 and Adamts1 in follicles cultured in vitro, N = 3. Scale bar: 100 μm. Data were analyzed by one-way ANOVA with Tukey’s post hoc test (B–D). All data are presented as the Mean ± SEM.

