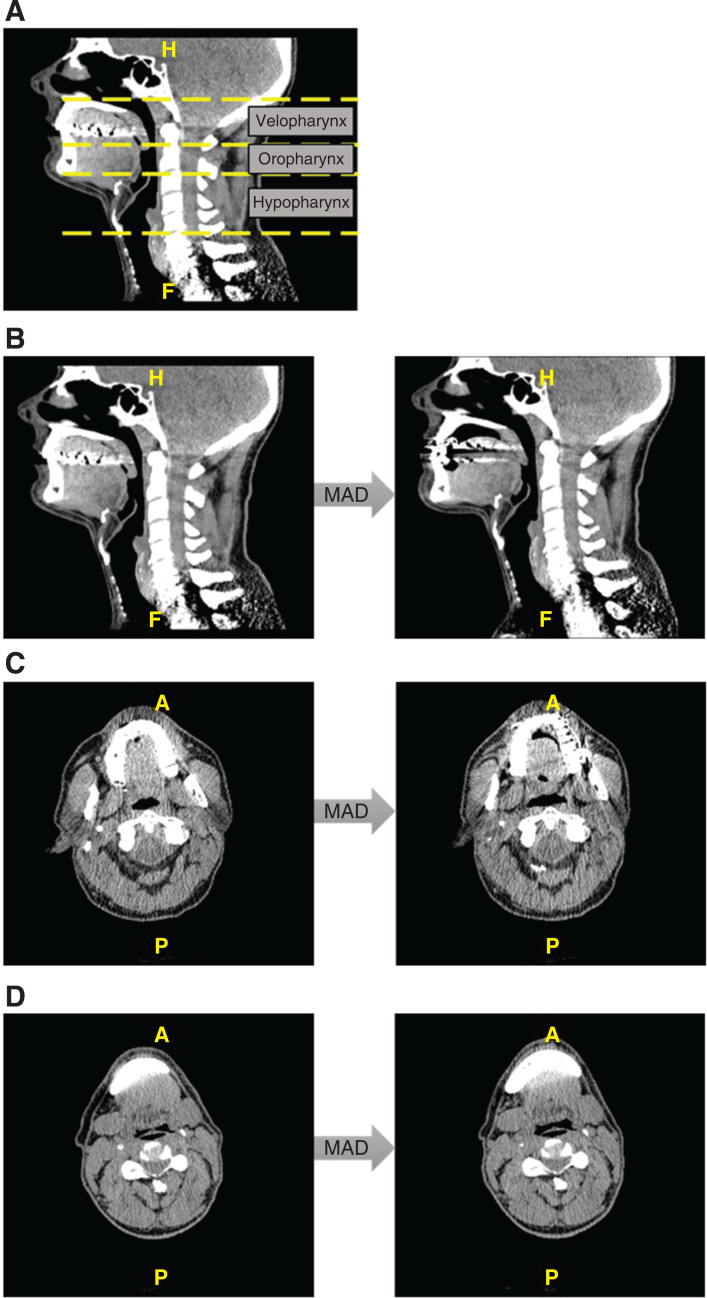
Figure 2. Low-dose CT scan images.
Subsegments of the UA on a midsagittal CT scan (A), UA changes due to MAD treatment on a midsagittal CT scan of a responder (B), velopharyngeal changes due to MAD treatment on an axial CT scan of a responder (C), and hypopharyngeal changes due to MAD treatment on an axial CT scan of a responder (D). A = anterior, CT = computed tomography, H = head, F = feet, MAD = mandibular advancement device, P = posterior, UA = upper airway.

