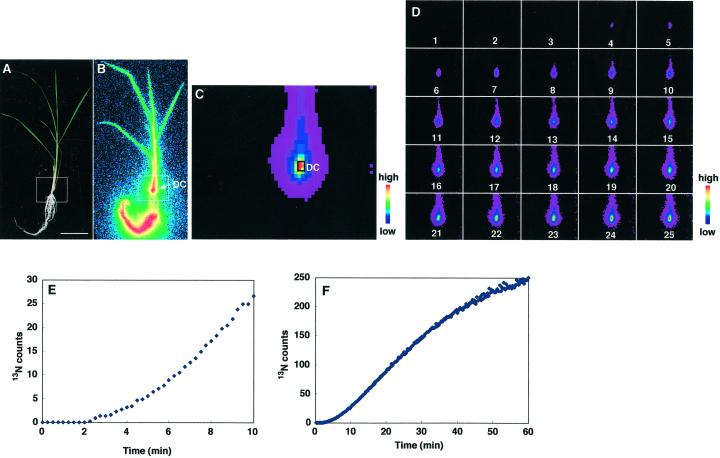
Figure 1.
13N translocation from roots to the DC of control rice supplied with 13NH4+. A, Gross image of a control rice plant. B, Image of 13N translocation using BAS-1500. Scale bar = 4 cm. C, Accumulative PETIS image after a 60-min analysis. D, The time course for the accumulation of radioactivity in the white squares in A and B was followed over time by PETIS. The images shown are for 1-min intervals and the data were scored every 15 s. E, Curve showing the accumulation of radioactivity in the DC after 10 (C) and 60 (F) min by PETIS.

