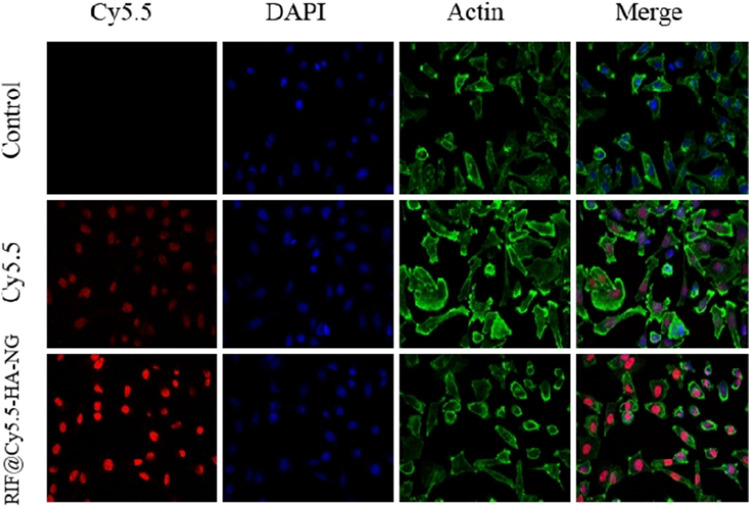
FIGURE 2.
Uptake of RIF@Cy5.5-HA-NG. Blue fluorescent image indicates the image of DAPI stained cells. Red fluorescence indicates uptake of Cy5.5 and RIF@Cy5.5-HA-NG. Green fluorescent image indicates the image of Actin. To demonstrate the uptake of RIF@Cy5.5-HA-NG nanoparticles, the laser confocal experiment was performed and the section-wise imaging of intracellular localization of nanoparticles was shown.

