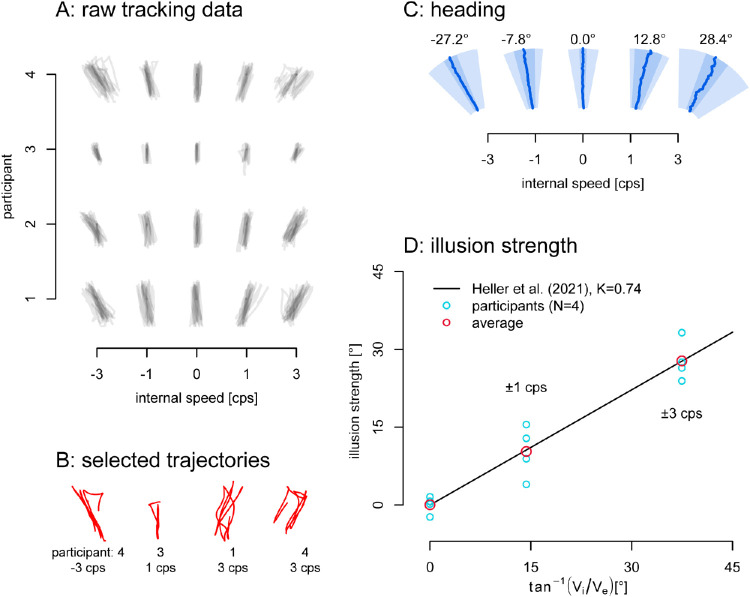
Figure 2.
Online Tracking Data. (A) Raw individual trajectories. In general, the traced paths approximate linearity, with the direction depending on the internal motion. (B) Four sample trials with anomalous deviations that may be resets. (C) Average heading of the middle one second of each pass. Distance from origin is time, angle is the heading angle. Dark blue lines show the average heading over time. The light blue depicts the average area (across participants) containing 90% of the heading data. The darker blue areas depict the 95% confidence interval of the mean heading. (D) The strength of the illusion in degrees angle deviation from the physical path. In red are the average illusion strengths for 0 cps, ±1 cps and ±3 cps, and in light blue the data for the 4 individual participants. Black line: prediction of the vector combination model of Equation 1 with K = 0.74 as in Heller et al. (2021), which is indistinguishable from the best fit to our data: K = 0.738.

