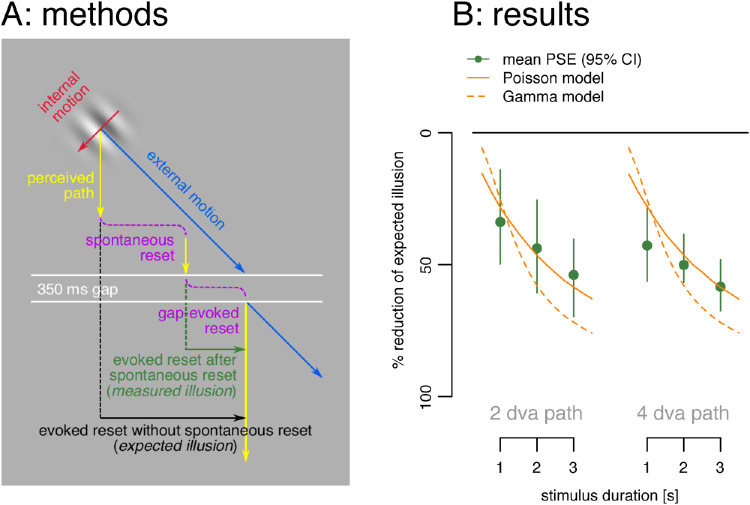
Figure 6.
Spontaneous resets without hand trajectories from Liu et al. (2021), re-analyzed here. (A) The Gabor's internal motion was adjusted for each condition and participant so that the perceived path was always locally straight down (yellow arrows). The 350 ms temporal gap (white lines) then ensured a full reset (Lisi & Cavanagh, 2015) to the physical location when the Gabor continued on its path following the gap (blue arrow). Gaps were presented after one, two, or three seconds, and two or four dva real paths and the offset measured between the pre- and post-gap paths (vertical green line) indicated the amount of illusion left at the end of the pre-gap path (measured illusion), which can be contrasted with the expected illusion if there were no spontaneous resets (black line). (B) Percent reduction of the illusion (difference between measured illusion and the expected illusion with no intervening spontaneous resets as a percentage of expected illusion) as a function of path length and duration. The size of the illusion decreased over time for a fixed path length and local illusion angle (green dots). These data are consistent with resets occurring randomly over time at ∼0.7/s modeled as a Poisson process (continuous orange line) and largely with the gamma distribution fit to the reset times found here (dashed orange line).

