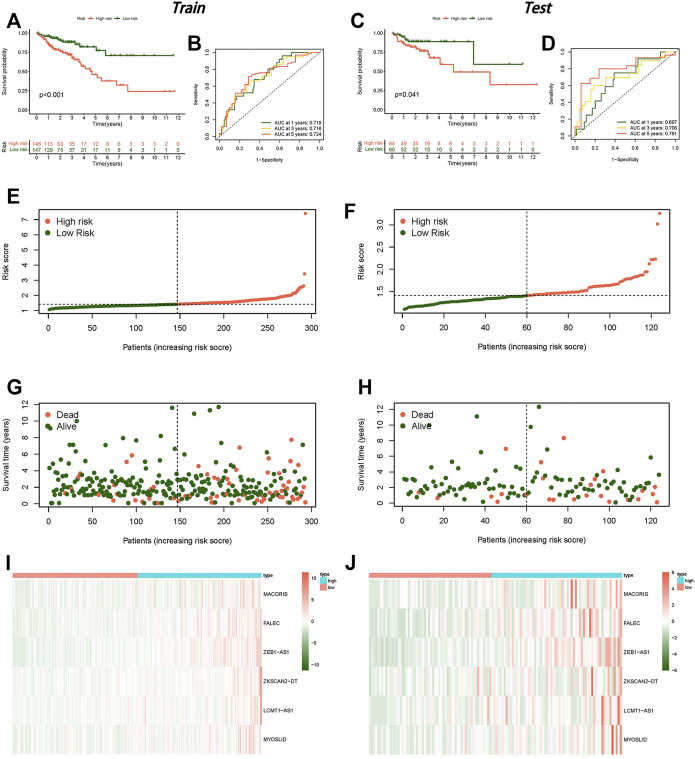
FIGURE 3.
Establishment of a risk model for necroptosis-related lncRNAs in colon cancer. (A) Kaplan–Meier curve for OS in the training group. (B) ROC curve in the training group. (C) Kaplan–Meier curve for OS in the testing group. (D) ROC curve in the testing group. (E) Risk score distribution in the training group. (F) Risk score distribution in the testing group. (G) OS status in the training group. (H) OS status in the testing group, (I) Heat map in the training group. (J) Heat map in the testing group.

