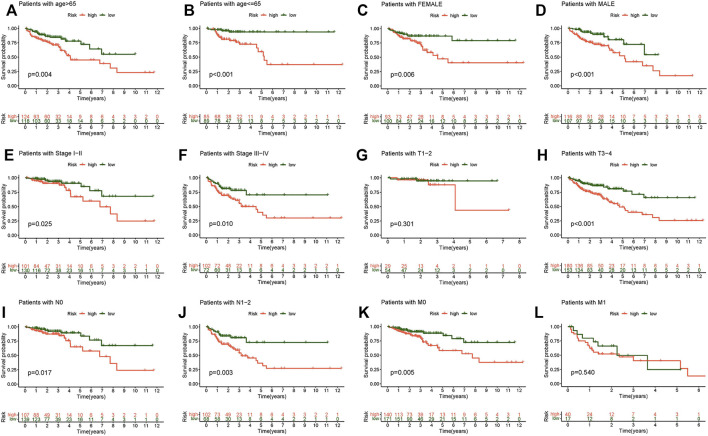
FIGURE 6.
Kaplan–Meier survival subgroup analysis for differential clinicopathological features in the high- and low-risk score group. (A) Patients with age >65. (B) Patients with age ≤65. (C) Female patients. (D) Male patients. (E) Patients with stages I-II. (F) Patients with stages III-IV. (G) Patients with stages T1-2. (H) Patients with stages T3-4. (I) Patients with stage N0. (J) Patients with stages N1-2. (K) Patients with stage M0. (L) Patients with stage M1.

