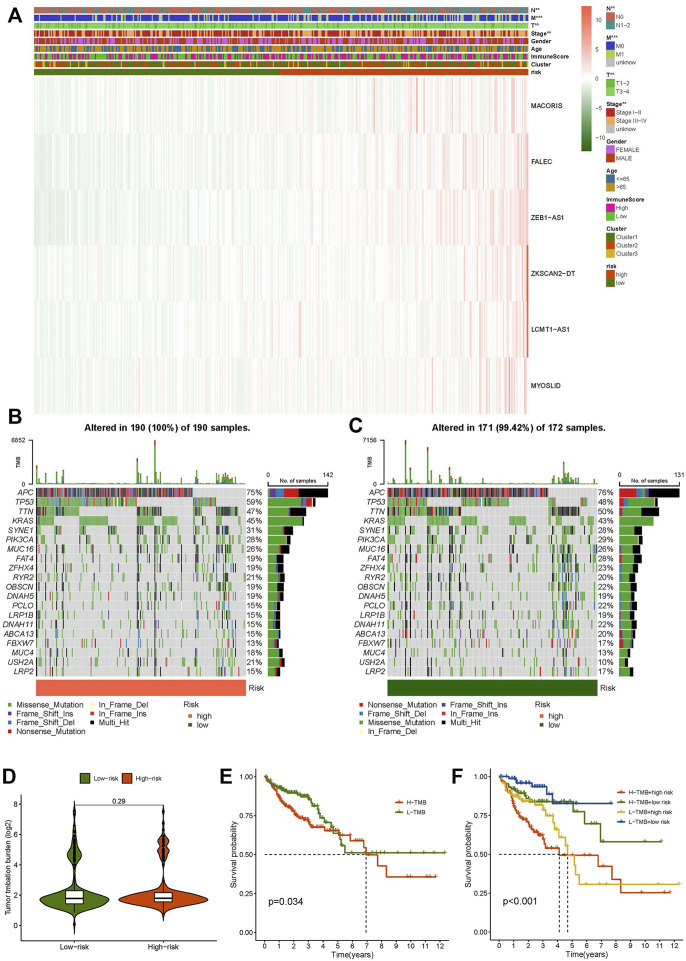
FIGURE 7.
Clinicopathological features in the high- and low-risk score group, TME analysis. (A) Heat map of clinicopathological features in the high- and low-risk group. (B) Waterfall plot displays mutation information of the genes with high mutation frequencies in the high-risk group. (C) Waterfall plot displays mutation information of the genes with high mutation frequencies in the low-risk group. (D) TMB difference in the high- and low-risk patients. (E) Kaplan–Meier curve analysis of OS is shown for patients in high and low TMB. (F) Kaplan–Meier curve analysis of OS is shown for patients classified according to the TMB and necroptosis-related lncRNA model.

