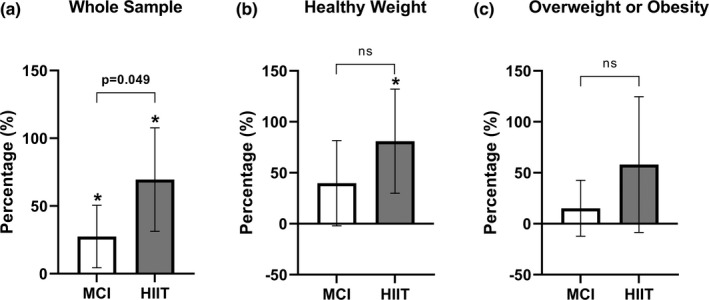
FIGURE 6.

(a, b, c) Percent change in plasma irisin levels from baseline to peak for the whole sample and stratified by obesity status. Data presented as mean and 95% confidence interval. MCI, moderate continuous intensity; HIIT, high intensity interval training. Alpha level at 0.05. * represents a significant change within the condition
