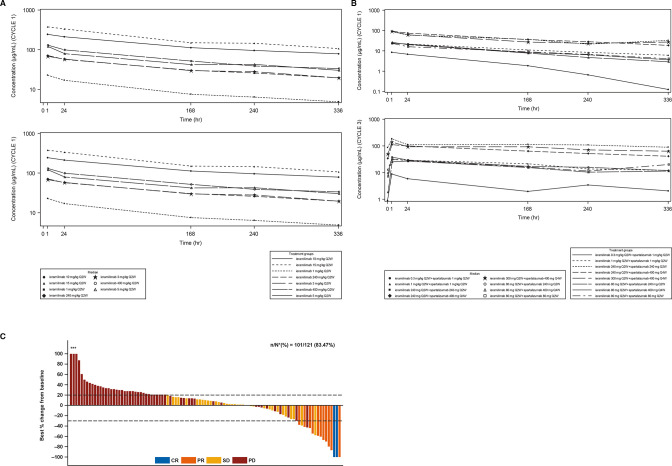
Figure 3.
Pharmacokinetics and best percentage change in tumors. (A) Median concentration–time profiles for Q2W dosing regimens for SA ieramilimab. (B) Median concentration–time profiles for Q2W dosing regimens for ieramilimab in combination with spartalizumab. (C) Waterfall plot for best percentage change of predefined target lesions from baseline in sum of longest diameters based on local radiology review of RECIST V.1.1 for patients treated with ieramilimab +spartalizumab *Indicates the bars where best percentage change from baseline has been cut at 100%. CR, complete response; PD, progressive disease; PR, partial response; Q2W, every 2 weeks; Q4W, every 4 weeks; RECIST, Response Evaluation Criteria In Solid Tumors; SA, single agent; SD, stable disease.

