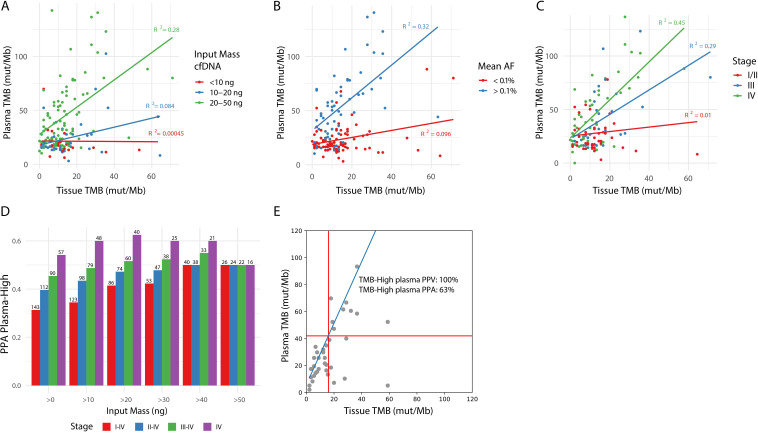
Figure 4.
cfDNA input, tumor burden and stage of disease impact PPA of blood-based TMB. (A) Impact of cfDNA input mass, divided into three categories (<10 ng, 10–20 ng, and 20–50 ng), on the correlation between tissue and plasma TMB after germline filtering. (B) Impact of mean AF on the correlation between tissue and plasma TMB after germline filtering. For each plasma sample, the mean AF in plasma of variants found in the tumor sample was used to estimate tumor burden, resulting in a tumor-informed mean AF. Points are colored based on mean AF of <0.1% (red) or >0.1% (blue). Only samples with >10 ng cfDNA input mass and with variants detected by the tumor tissue panel which overlap with regions of the lung TMB panel are included in this plot. (C) Impact of stage of disease on the correlation between tissue and plasma TMB. Only samples with >10 ng cfDNA input mass are included in this plot. (D) The effect of a combination of cfDNA input mass and stage of disease on PPA for TMB high calls in plasma based on a 16 mut/Mb cut-off in tTMB is shown on the Y-axis. The cell-free DNA input mass was categorized into >0, 10, 20, 30, 40, 50 ng and is shown on the X-axis. Stage of disease was categorized as I–IV, II–IV, III–IV, or IV and is represented by the color of the bars. The number of samples included in the analysis is listed above each bar. (E) Tissue TMB vs plasma TMB for stage IV samples with >20 ng cfDNA input mass (n=39). The linear relationship between the tissue and lung TMB panels is shown in blue, and TMB cutoffs corresponding to 16 mutations/Mb in the tissue panel are shown with red lines. PPA and PPV of plasma TMB high calls (as defined in figure 3B) are shown. AF, allele frequency; PPA, positive per cent agreement; PPV, positive predictive value; TMB, tumor mutational burden.

