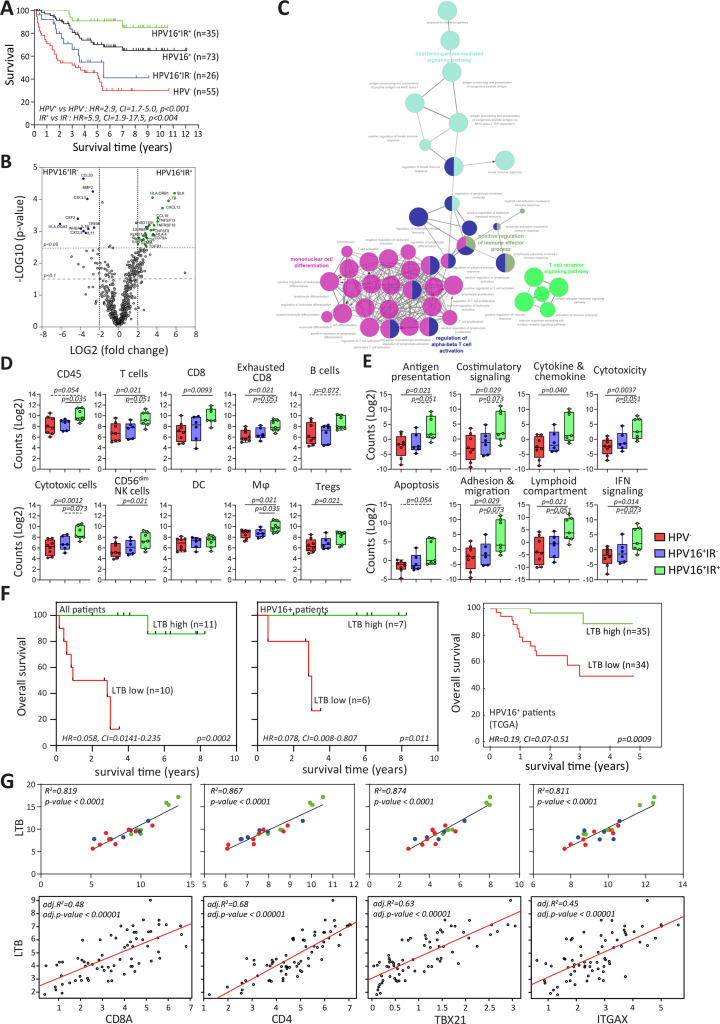
Figure 1.
Immune signature of TME impacts survival of patients with OPSCC. (A) Kaplan-Meier survival curves of prospectively followed up cohort of HPV− and HPV16+ patients with OPSCC, the latter of whom are also subdivided into those with a tumor-specific T-cell response (HPV16+IR+) and those lacking this immune response (HPV16+IR−). (B) Volcano plots of upregulated DEGs identified by NanoString Pancancer IO360 between HPV16+IR+ (right) and HPV16+IR− (left). The dotted lines indicate the Benjamini-Hochberg adjusted p<0.05 and p<0.1 thresholds. (C) ClueGo of DEGs (p<0.1) between HPV16+IR+ and HPV16+IR− patients, visualizing the pathways in which these genes are involved. (D) Deconvoluted cells by expression of genes predefined for different immune cell types depicted as counts in HPV−, HPV16+IR− and HPV16+IR+ OPSCC. (E) Differential expression of predefined pathway genes in HPV−, HPV16+IR− and HPV16+IR+ OPSCC. (F) Kaplan-Meier survival curves based on high/low LTB expression (classification based on median LTB expression), in all patients with OPSCC analyzed by NanoString Pancancer IO360 (n=21), in the HPV16+ patients within this cohort (n=13) and in a large independent TCGA cohort of HPV16+ OPSCC (n=69). (G) Linear regression analyses of top upregulated DEG LTB in HPV16+IR+ compared with HPV16+IR− OPSCC versus cell-type profiles of CD8 (CD8A), CD4, Tbet+ T cells (TBX21) and DC (ITGAX, CD11c) both for this cohort (n=21, upper panel) and the TCGA cohort of HPV16+ OPSCC (n=69, lower panel). HPV− (red), HPV16+IR− (blue) and HPV16+IR+ (green). DC, dendritic cell; DEG, differentially expressed gene; HPV, human papillomavirus; IR+, immune responsiveness; IR−, lack of immune responsiveness; OPSCC, oropharyngeal squamous cell carcinoma; TCGA, The Cancer Genome Atlas; TME, tumor microenvironment.

