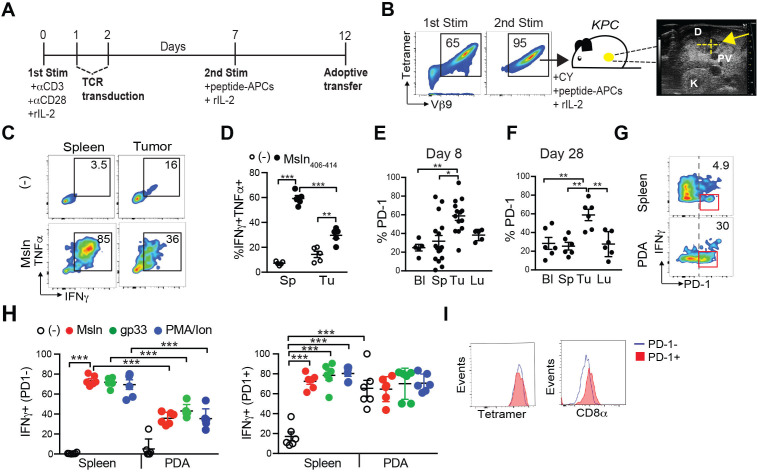
Figure 1.
Functional deficits in both PD-1+ and PD-1- TCR engineered T cells infiltrating PDA. (A) Generation of murine TCRMsln T cells for adoptive cell therapy. Congenic P14 CD8 +T cells are activated with anti-CD3 +anti-CD28 (first Stim), transduced with the high affinity TCRMsln (1045), and restimulated (second Stim) in vitro with irradiated peptide-pulsed splenocytes, and transferred on day 12. T cells are supplemented with recombinant human IL-2 (rIL-2) every other day. (B) Representative staining for Msln406-414:H-2Db tetramer and Vβ9 staining in TCRMsln cells 5 days following the first Stim, or 5 days following the second Stim in vitro according to figure 1A. T cells are infused into KPC mice bearing a 3–6 mm pancreas mass detected by high-resolution ultrasound. The T cell therapy protocol consists of Cytoxan (CY) 6 hours prior to T cell infusion and T cells administered with irradiated peptide-pulsed splenocytes (peptide-APCs) and IL-2. Arrow, hypoechoic pancreas tumor; D, duodenum. PV, portal vein; K, kidney. (C) Cytokine production by CD8+ Thy1.1+ TCRMsln T cells following ex vivo restimulation ± Msln406-414 peptide on day 8. Representative of 5 mice. (D) Proportion of TCRMsln T cells coproducing IFNγ and TNFα was determined by intracellular cytokine staining. Each dot is an independent animal. Data are mean±SEM *p<0.05; **p<0.01, ***p<0.001, one-way ANOVA and a Tukey’s post-test. Proportion of TCRMsln cells that express PD-1 at day 8 (E) and day 28 (F) post-transfer. Bl, blood; Sp, spleen; Tu, tumor; Lu, Lung. Each dot is an independent mouse. Data are mean±SEM one-way ANOVA and a Tukey’s post-test. *P<0.05; **p<0.01. (G) PD-1 and IFNγ gated on TCRMsln cells at 8 days postinfusion and following a 4 hour ex vivo restimulation with Msln406-414 peptide. (H) Proportion of PD-1- (left graph) and PD-1+ (right graph) TCRMsln cells producing IFNγ at 8 days post-transfer following the indicated stimulations: Msln406-414 peptide (triggers the transduced TCR), gp33 peptide (triggers the endogenous TCR), and a positive control PMA +Ionomycin (PMA/Ion). Each dot is an independent mouse. Data are mean±SEM. Note that the left graph is cytokine production by PD-1-negative TCRMsln cells and the right graph is cytokine production by PD-1 +TCRMsln cells and do not reflect the percentages shown in the plots in figure 1G which are gated on total TCRMsln cells. One-way ANOVA and a Tukey’s post-test. ***P<0.001. (I) CD8α staining on intratumoral PD-1+ (red) and PD-1- (blue) TCRMsln cells on day 8 post-transfer. ANOVA, analysis of variance; PDA, pancreatic ductal adenocarcinoma; PMA, phorbyl-12 myristate 13-acetate.

