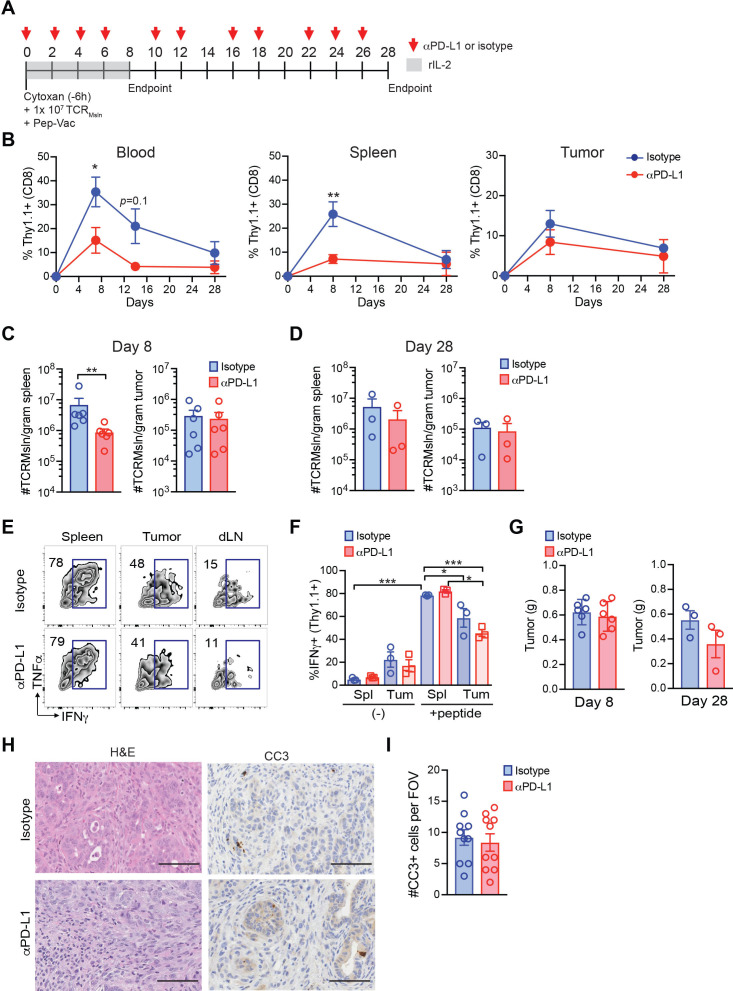
Figure 2.
TCR engineered T cells fail to respond to PD-L1 blockade. (A) T cell therapy protocol following αPD-L1 or isotype in KPC mice. (B) Proportion of TCRMsln of total CD8+ T cells in blood, spleen, or tumor. Data are mean±SEM Student’s t-test, *p<0.05, **p<0.01. Number of TCRMsln cells per gram spleen or tumor at day 8 (C) or day 28 (D). Each dot is an independent mouse. Data are mean±SEM Student’s t-test. **P<0.01. (E) Representative FACs plots gated on TCRMsln cells following ex vivo restimulation with antigen at day eight post-transfer ±αPD-L1 or isotype. Numbers in graphs are the frequency of TCRMsln cells producing IFNγ. dLN, pancreatic draining lymph nodes. (F) Proportion of TCRMsln cells producing IFNγ at day 8 post-transfer. Each dot is an independent mouse. Spl, spleen; Tum, tumor. Data are mean±SEM. (-), no peptide. One-way ANOVA and a Tukey’s post-test among the no peptide (-), or the +peptide groups. *P<0.05; ***p<0.001. (G) Tumor weights in grams (g) at day 8 or day 28 post-therapy. Each dot is an independent animal. Data are mean±SEM. (H) Histology and cleaved caspase 3 (CC3) staining of representative tumors following TCRMsln cell therapy and indicated antibodies at day 28. (I) Number of CC3 +cells per field of view (FOV) at day 28 post-therapy. Data are mean±SEM. ANOVA, analysis of variance.

