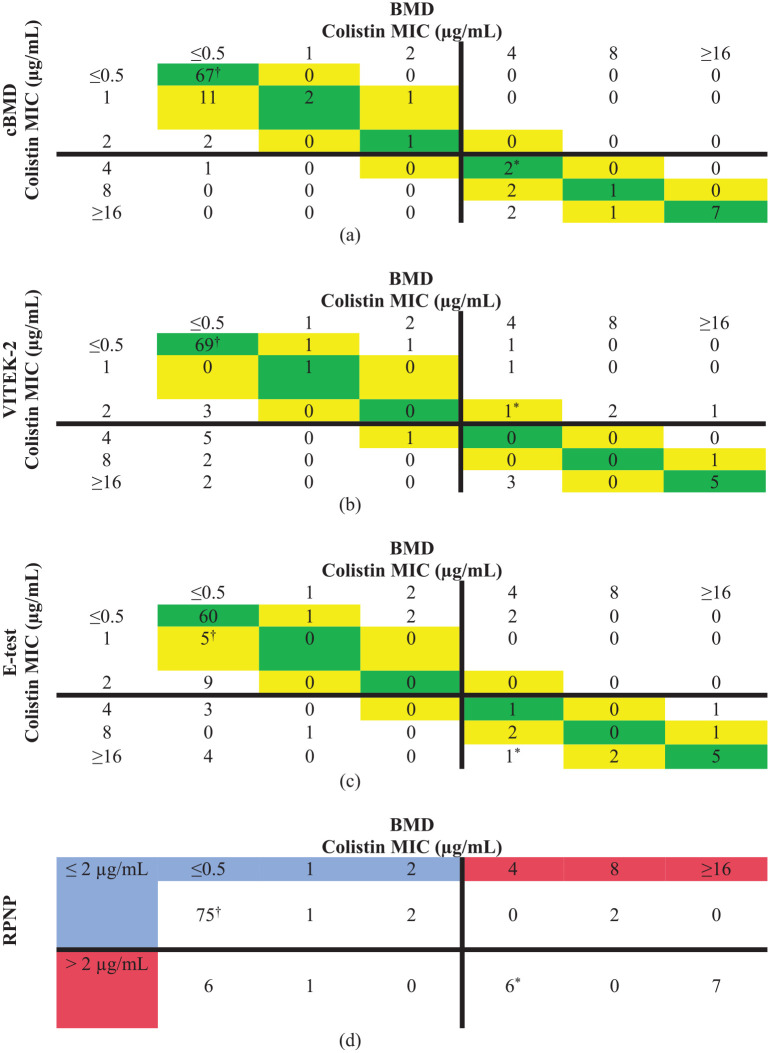
Figure 1.
Scatter diagram of colistin MICs obtained by BMD compared with a) cBMD, b) VITEK-2, c) E-test, and d) CNP for 100 isolates. Essential agreement is highlighted in green (perfect agreement) and yellow (±1 log2 dilution). The solid horizontal and vertical lines represent the clinical breakpoint value established by CLSI/ EUCAST. Blue color signifies susceptible MIC, whereas Red color signifies resistance MIC range. Escherichia coli NCTC 13846 (mcr-1 positive) and Escherichia coli ATCC 25922 (colistin susceptible) are represented by * and †, respectively.

