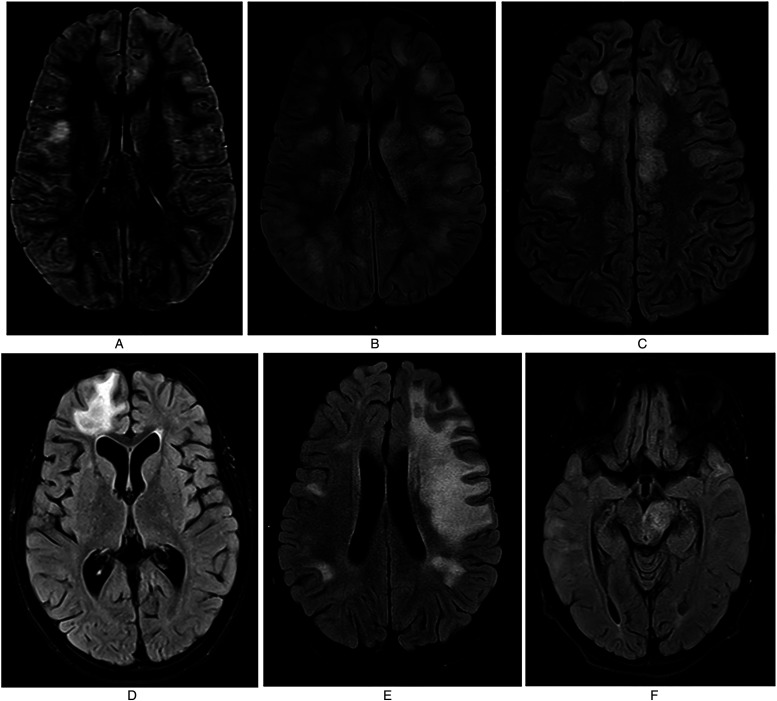
Figure 1.
A: Initial MRI showing bilateral T2 FLAIR hyperintensities throughout concerning for ADEM. Figure 1B: Repeat MRI obtained during second hospitalization (day 26) showing worsening lesion burden with more extensive T2 FLAIR hyperintensities throughout. Figure 1C: New T2 FLAIR lesions seen on MRI during third hospitalization (day 70) after second dose of rituximab. Figure 1D: Repeat MRI obtained during maintenance therapy with alternating IVIg and IVMP therapy on day 160 showing large tumefactive lesion in superior and middle frontal gyrus. Figure 1E: Routine surveillance MRI obtained 1 year after disease onset, after spacing of IVIg therapy, showing hyperintensities spanning a large portion of the left hemisphere. Figure 1F: New T2 FLAIR hyperintensities seen after IVIg was discontinued and patient was maintained solely on monthly tocilizumab monotherapy.

