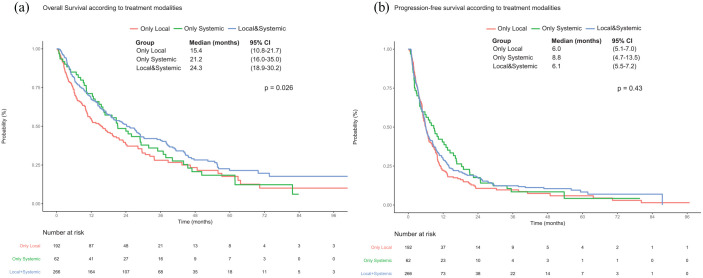
Figure 4.
Kaplan–Meier curves for (a) overall survival and (b) progression-free survival in patients who received local treatment or systemic therapy in our population of interest, according to treatment modalities (local treatment only versus systemic therapy only versus local treatment and systemic therapy) (log-rank p = 0.026 and 0.43, respectively).
CI, confidence interval; OS, overall survival; PFS, progression-free survival.

