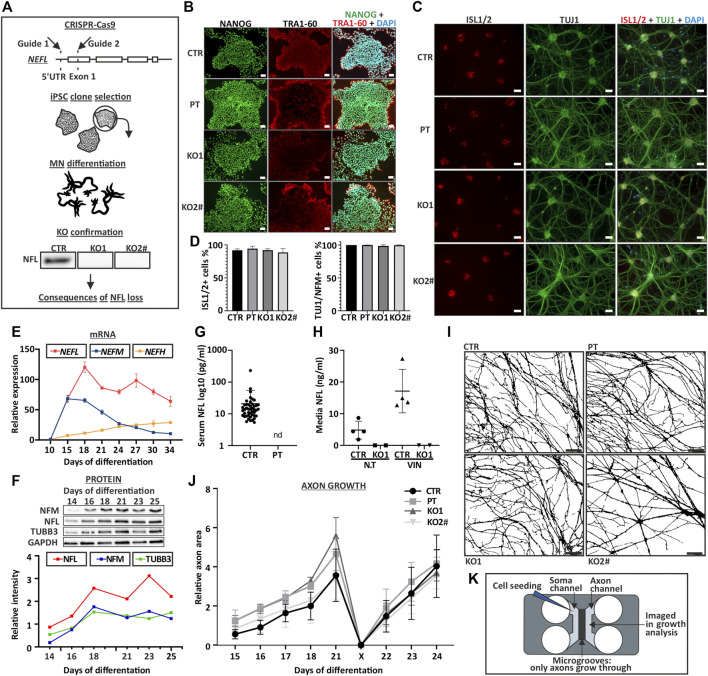
FIGURE 1.
Characterization of NEFL KO iPSC and motor neurons. (A) NEFL was knocked out from control iPSC with two guides targeting 5′UTR and Exon 1. iPSC clones were selected for differentiation. KO candidates were differentiated into motor neurons and absence of full-length NFL was confirmed by immunoblotting. Cell lines with no signal in immunoblotting were used for further assays. (B) NEFL KO and patient (PT) iPSC lines are pluripotent. Control (CTR), NEFL KO (KO1 and KO2) and PT iPSC express pluripotency markers NANOG (green) and TRA-1-60 (red), analyzed by immunocytochemistry (nuclei counterstain with DAPI, blue). Scale bar 50 µm. (C) KO and PT iPSC differentiate with similar efficiency as the isogenic control. Differentiation efficiency of Day 35 motor neurons was assayed by counting ISL1/2 (red) positive and TUJ1 (green) or NFM (not shown) positive cells in immunocytochemistry. DAPI counterstain (blue). Scale bar 50 µm. (D) Quantification of C. Average % of positive nuclei/cytoplasm with standard deviation (SD). Six replicates from three independent differentiations with 18 frames. One-way ANOVA followed with Dunnett’s multiple comparison post hoc test vs. CTR. p > .05. (E) NEFL, NEFM, and NEFH mRNA expression during differentiation. N = 2-3 per time-point. Normalized to ACTB expression and to day 10 expression of respective gene. (F) NFL, NFM, and TUBB3 protein levels during differentiation. Normalized to GAPDH signal intensity. N = 1 per time-point. (G) NFL measurement by Simoa from serum of control individuals and PT. Each dot indicates an individual sample [control values are the same as in (Järvilehto et al., 2021)]. Nd = not detectable. Average with SD (pg/ml). (H) NFL measurement by Simoa from iPSC-MN culture media. Treatment with the neurotoxic drug vincristine (VIN), which induces axonal degeneration was used as a positive control. N.T = not treated. CTR n = 4 and KO1 n = 2. Average with SD (ng/ml). (I) Axonal growth is not affected by NFL loss. Masks of phase contrast images of day 21 motor neuron axons in a microfluidic device (Xona, 450 μm). Scale bar 100 µm. (J) Quantification of image I. axon area on axonal side of microfluidic device. Axonal growth and regrowth after mechanical axotomy is not affected by NFL loss. Average relative area of axonal coverage and SEM. n = 3 independent experiments/cell line with 5 frames analyzed per time point. Growth normalized to average day 15 axon area per experiment. X indicates axotomy. Two-way ANOVA followed with Tukey’s multiple comparison post hoc test p > .05. ( K ) Schematic of a microfluidic device used for axon analysis. # indicates abnormal karyotype.

