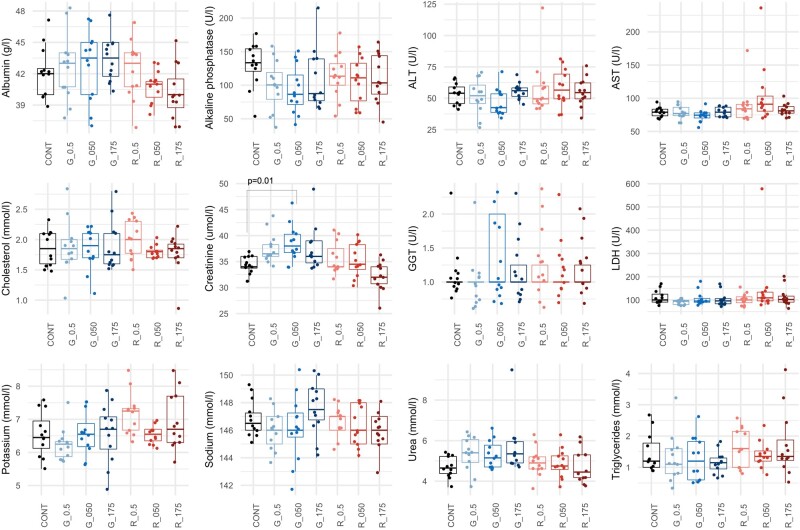
Figure 4.
Serum biochemistry analysis of rats following subchronic 90-day exposure to glyphosate and Roundup MON 52276. Clinical biochemistry evaluation in female rats administered with glyphosate (G_0.5: 0.5 mg/kg bw/day; G_050: 050 mg/kg bw/day; G_175: 175 mg/kg bw/day) and MON 52276 (R_0.5: 0.5 mg/kg bw/day; R_050: 050 mg/kg bw/day; R_175: 175 mg/kg bw/day). Results at the end of the treatment period revealed minor changes with only creatinine showing a statistically significant increase at the highest dose of glyphosate. Serum biochemistry values are shown as box plots with the median, 2 hinges (the 25th and 75th percentiles), and 2 whiskers extending to the furthest observation ≤1:5 times the interquartile range, along with individual values for each analyte (solid circles; n = 12 per group). The p-value is from a 1-way ANOVA with post hoc Tukey honestly significant difference.

