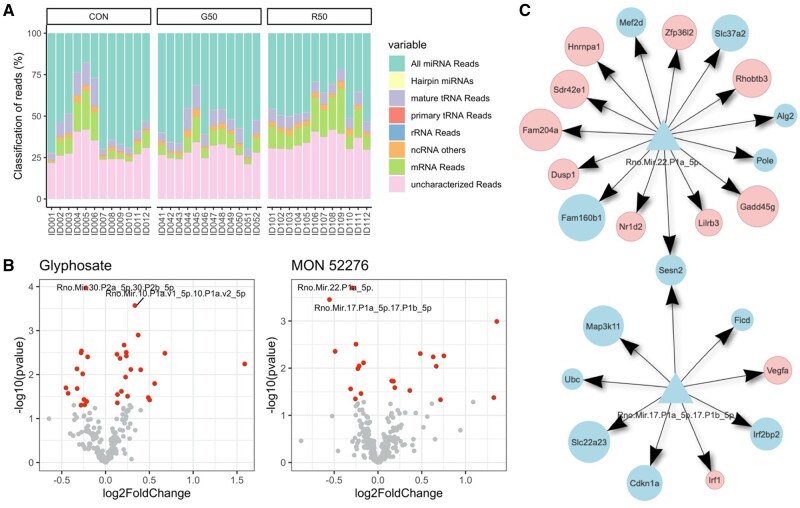
Figure 7.
Small RNA profiles in liver samples from rats exposed to glyphosate or MON 52276. (A) Small RNAs were classified based on their sequences using miRge3.0. (B) Volcano plots showing the results from the analysis of miRNA differential abundance for glyphosate (left panel) or MON 52276 (right panel) exposed animals. Red dots represent miRNA with their unadjusted p-value < .05. Only 4 miRNAs were found to pass corrections for multiple comparisons (labeled dots). (C) Genes predicted to be regulated by the differentially expressed miR-22 (top diagram) and miR-17 (lower diagram), which had their expression levels significantly decreased by MON 52276. TargetScan was used to predict gene targets (circles) of miRNAs (triangles). Targets which were not found to have their expression levels affected by MON 52276 were filtered out. Genes are classified as downregulated (blue) or upregulated (red). None of the miRs affected by glyphosate treatment were predicted to regulate glyphosate-altered mRNAs (n = 12 per group).

