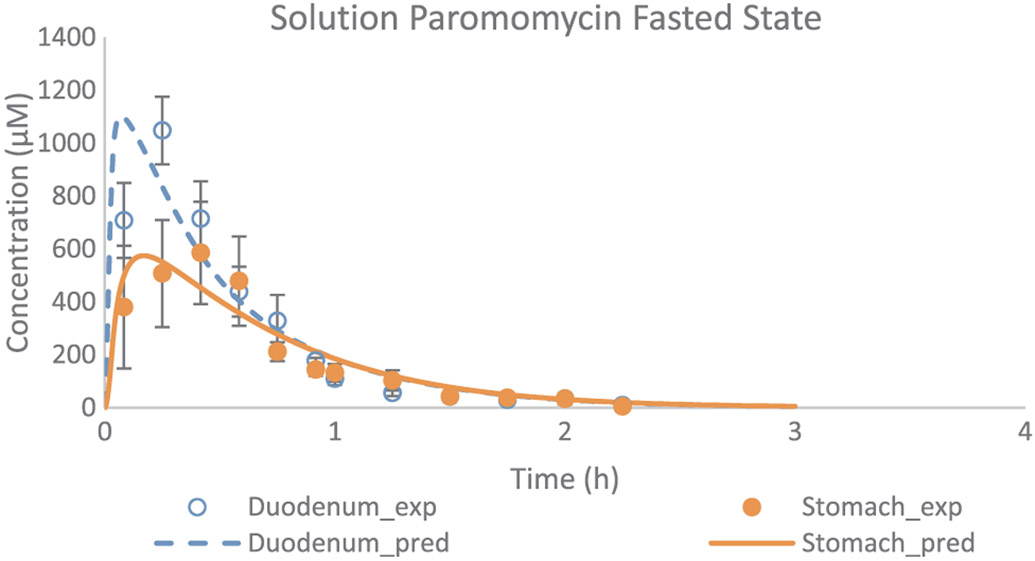
Fig. 8.
Experimental and adjusted fasted state concentration-time profiles of paromomycin as a function of time. Applied values were derived from the adjustments of Model 8. Observed values are expressed as mean ± SEM (n = 5) and obtained from literature [13].

