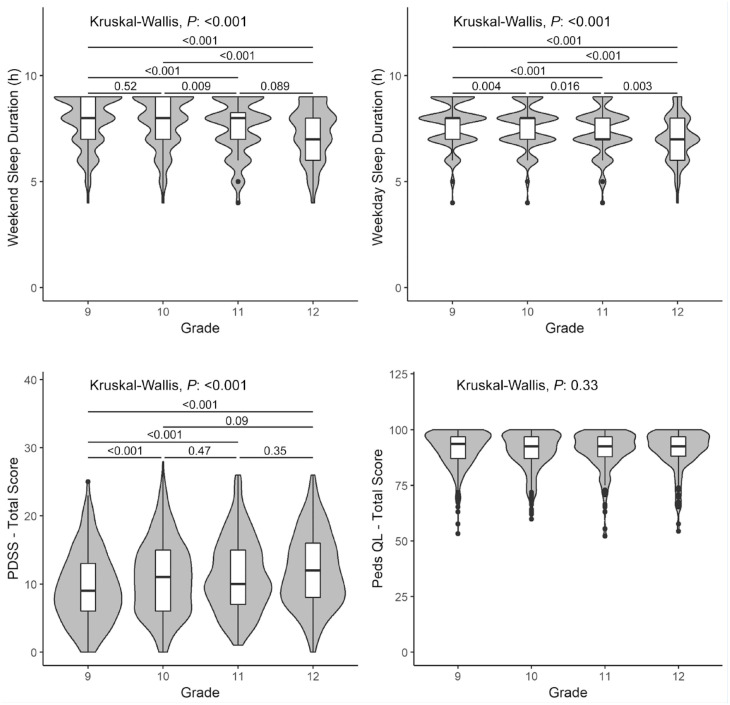
Figure 3.
Quality of life, daytime sleepiness, and sleep duration by grade among female high school volleyball athletes. Data shown as violin plots representing the median, interquartile range, and kernel density distribution of the data, with significance levels from Kruskal-Wallis and post hoc pairwise Wilcoxon rank sum tests, if indicated. Wider sections of the violin plots represent a higher probability of a given value, while thinner sections represent a lower probability. PDSS, Pediatric Daytime Sleepiness Scale; PedsQL, Pediatric Quality of Life.

