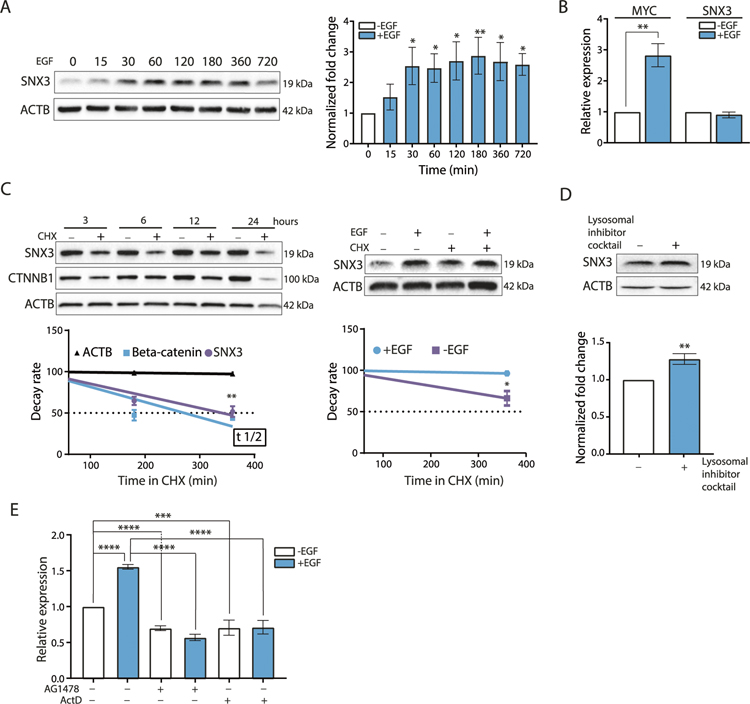
Fig. 1. EGF induction of SNX3.
A Western blotting analysis for SNX3 in MCF10A cells treated with EGF (20 ng/ml) for the indicated time points (minutes). ACTB was used as a loading control. Blots are representative of 3 independent treatments. Graphs show densitometric quantification of bands. The data represent the mean (SD) of 3 experiments. One-way ANOVA with Tukey’s multiple comparison test was used, *p < 0.05, **p < 0.01. B RT-qPCR for the expression of MYC and SNX3 upon EGF stimulation (20 ng/ml, for 30 min) relative to untreated MCF10A cells. The data represent the mean (SD) of 3 independent treatments. Unpaired t-test was performed for statistical significance, **p < 0.01. C Western blotting analysis for the decay rate of SNX3 protein in MCF10A cells treated with CHX (30 μg/ml) with or without EGF (20 ng/ml) for the indicated time points. Cell lysates were immunoblotted for SNX3, for ACTB as a loading control, and for CTNNB1 (Beta-catenin) as a positive control for CHX treatments. The data represent the mean (SD) of 3 independent treatments. Unpaired t-test with Welch’s correction was performed for statistical significance, *p < 0.05, **p < 0.01. D MCF10A cells were treated with a lysosomal inhibitor cocktail (10 μM Leupeptin, 1.5 μM Pepstatin A, 1 μM E-64) for 24 h, and lysates were collected. Blots are representative of 3 independent treatments. Graphs show densitometric quantification of bands. Unpaired t-test was performed for statistical significance, ** indicates p < 0.01, E RT-qPCR for SNX3 mRNA. MCF10A cells were pre-treated with actinomycin D (10 μg/ml) for 1 h and with (EGF 20 ng/ml) for 12 h. The data represent the mean (SD) of 3 independent treatments. One-way ANOVA with Tukey’s multiple comparison test was used ***p < 0.001, ***p < 0.0001.

