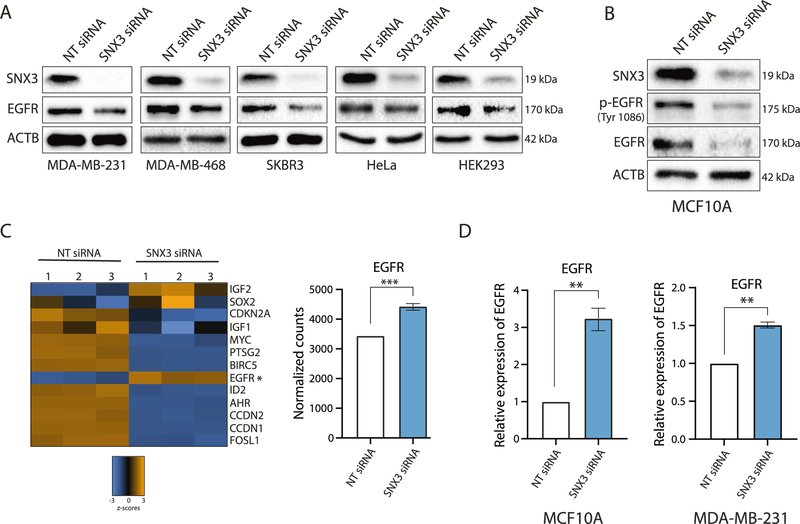
Fig. 5. Effects of transient SNX3 silencing.
A Western blotting analysis for SNX3 and EGFR on lysates from indicated cell lines treated with SNX3 siRNA pool or non-targeting siRNAs (NT) for 48–72 h. Blots are representative of at least two independent experiments. B Western blotting analysis for SNX3, p-EGFR (Tyr1086), and EGFR on lysates from MCF10A cells transfected with NT siRNA and SNX3 siRNA for 72 h. Blots are representative of 2 independent experiments. C Transcription level changes in NT siRNA and SNX3 siRNA transfected MCF10A cells using the NanoString Vantage 3D RNA cartridge. Blue and orange colors on the heat map represent z scores. The asterisk shows EGFR mRNA. The graph shows normalized mRNA counts for EGFR. Unpaired t-test was performed for statistical significance, ***p < 0.001. D RT-qPCR for the expression of EGFR relative to RPLP0 in MCF10A and MDA-MB-231 cells transfected with SNX3 siRNA compared to NT siRNA transfected cells. Unpaired t-test was performed for statistical significance, **p < 0.01.

