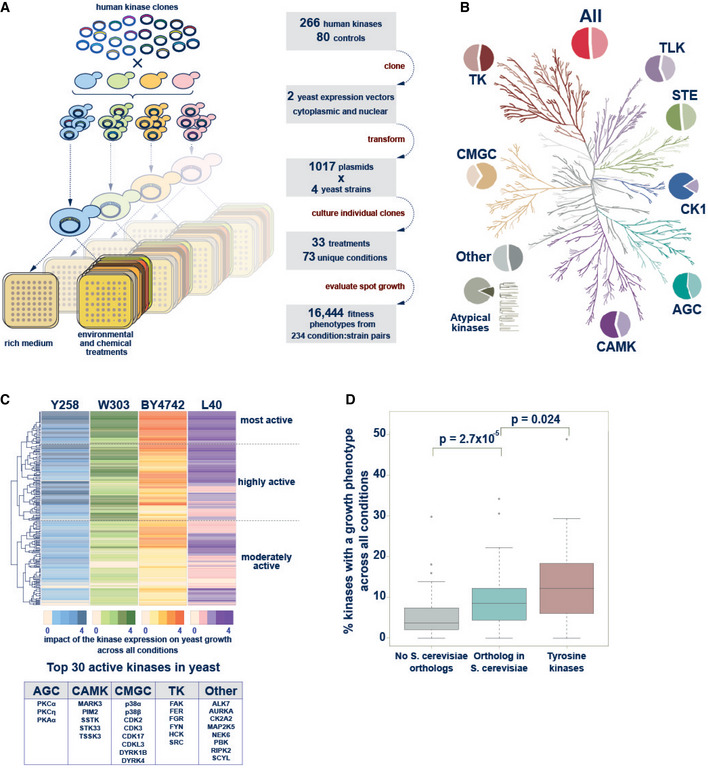
Figure 1. The human kinase yeast array.

- Schematic representation of the principle of the kinase yeast array and a flow diagram showing the construction of the human kinase array.
- The Human Kinome Tree representing 518 kinases in nine families (modified from (Manning et al, 2002) using CORAL at http://phanstiel‐lab.med.unc.edu/CORAL/). Pie charts indicate the fraction of kinases contained in the human kinase yeast array. In total, 266 human protein kinases and 52% of the human kinome is represented in the array.
- Hierarchical clustering of the results of the yeast growth phenotype screen. In each strain, the 266 kinases were binned (0–4) according to the number of conditions in which the kinase caused a growth phenotype. Hierarchical clustering revealed sets of topmost (52), highly (98), and moderately active (116) kinases. Top 30 active kinases causing many growth phenotypes across all conditions‐strain pairs are listed.
- Comparison of the fraction of kinases that result in a growth phenotype across all conditions‐strain pairs. Kinases are grouped into 179 (67%) with a yeast ortholog and 87 (33%) human protein kinases without orthologous yeast kinases. The latter group includes 41 tyrosine kinases and 46 S/T kinases which were separated in the analysis. The former group contains both one‐to‐many and many‐to‐many orthologous kinases. Tyrosine kinases that strongly inhibited yeast growth and human kinases that are orthologous to yeast kinases were more likely to perturb yeast growth than human kinases without a yeast ortholog. Data are from a single large‐scale growth measurement. The boxes extend from 1st to 3rd quartile with the central band representing the median. The whiskers extend to the furthest point up to 1.5 times the interquartile range away from the nearest quartile, with any further points marked as outliers. P‐values are calculated using the Mann–Whitney test.
