Figure 8.

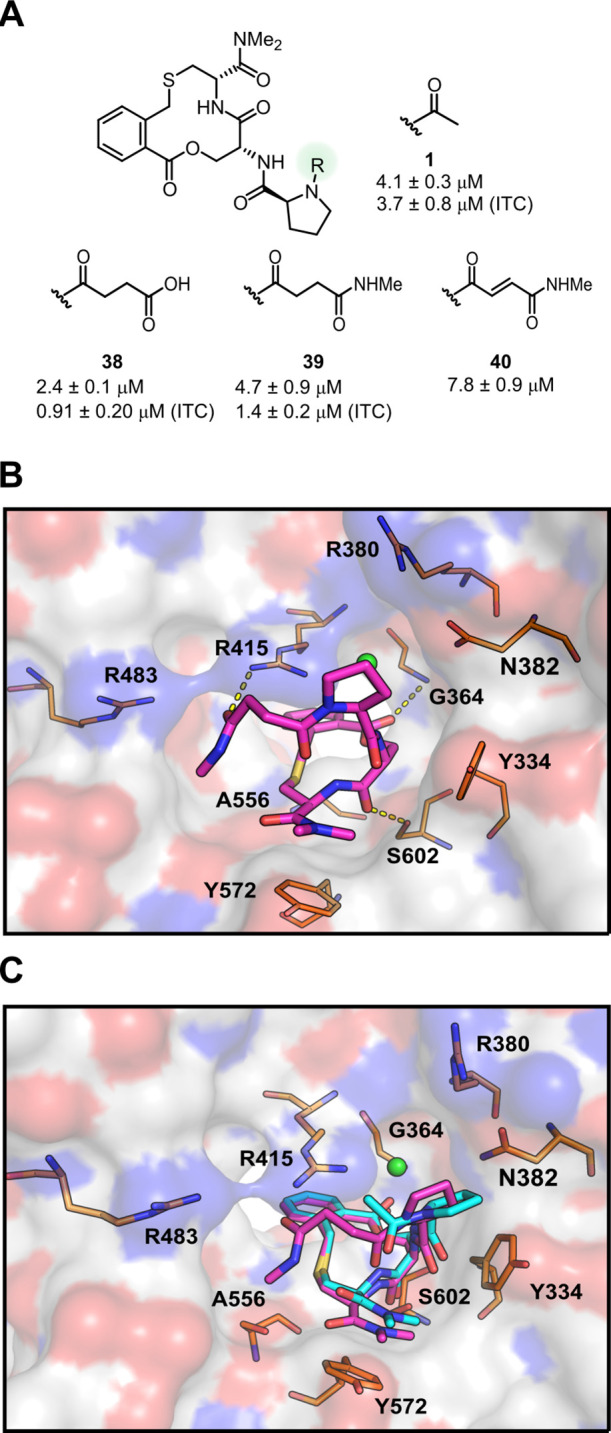
Initial attempts of the structure-based design of Keap1 inhibitors forming interactions with R415. (A) Structures and inhibitory activities of compounds 38–40. Compound 1 is shown for reference. Dissociation constants were obtained by SPR using an ISA for 1 and 38–40 and also by ITC for compounds 1, 38, and 39. Mean values ± standard deviation derived from a minimum of three experiments are reported. (B) Crystal structure of the complex between Keap1 and compound 39 determined at a 2.6 Å resolution (PDB ID: 7Q6Q). (C) Superimposition of the complexes of compound 39 (magenta) and compound 1 (teal, PDB ID: 6Z6A) with Keap1. Keap1 is shown as a white surface with oxygen atoms in red and nitrogen atoms in blue in (B,C). Selected Keap1 residues are shown as orange sticks. Hydrogen bonds to Keap1 are indicated by yellow dashed lines. A chloride ion is shown as a green sphere. For clarity, only Keap1 from the complex with compound 39 is shown.
