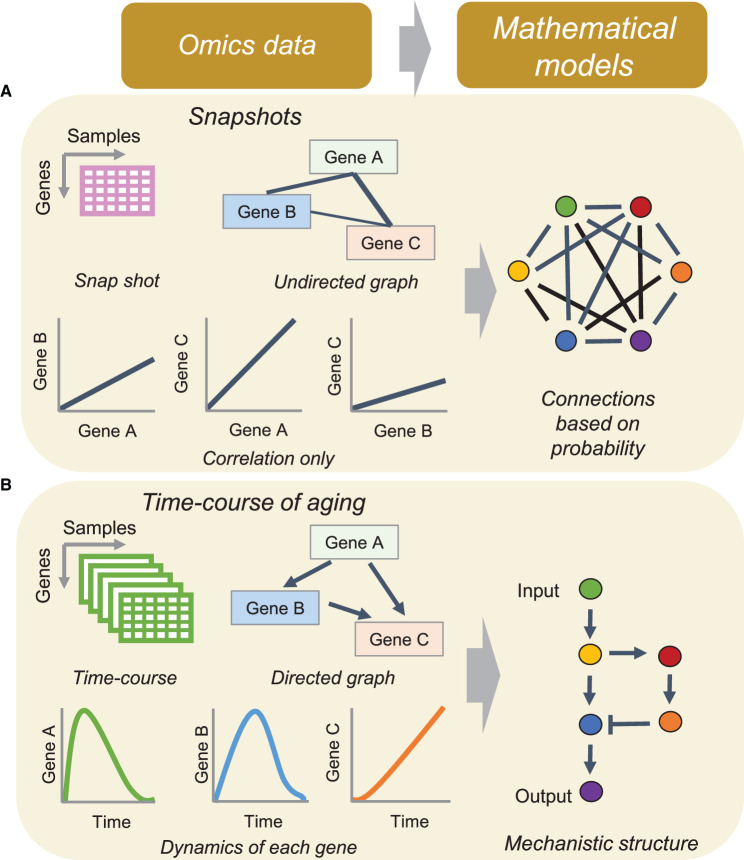
Figure 3. Differences between time-course and snapshot omics analysis.
(A) Time-course aging omics showing a directed graph between the gene regulatory network and the dynamics of each gene. By integrating these data with mathematical models, mechanisms of biological functions can be obtained. (B) Snapshot omics studies do not provide information on the underlying regulatory mechanisms but provide only information regarding the correlations between genes. For these datasets, we can only construct mathematical models based on the probability of correlation among genes.

