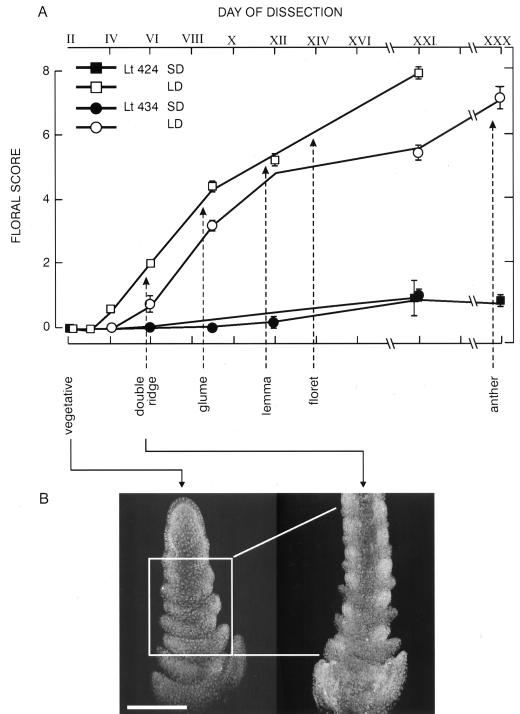
Figure 5.
A, Floral score, assessed by dissection, of L. temulentum shoot apices as a function of time after a single inductive LD (Day II). Values are means ± se, n = 10; some error bars are hidden by the symbols. Vertical arrows are positioned to indicate developmental stages. A three-dimensional pattern of expression of LtMADS1 mRNA (B) obtained by in situ hybridization was generated by apex reconstructions obtained by stacking/combining the images from four to five longitudinal sections up to the median one for a vegetative (SD) or LD IV early double-ridge stage apex (single median images shown in Fig. 6, B and C, respectively). Images were digitized and cropped using Adobe Photoshop and stacked using Confocal Assistant 4.02. The bar is 200 μm.

