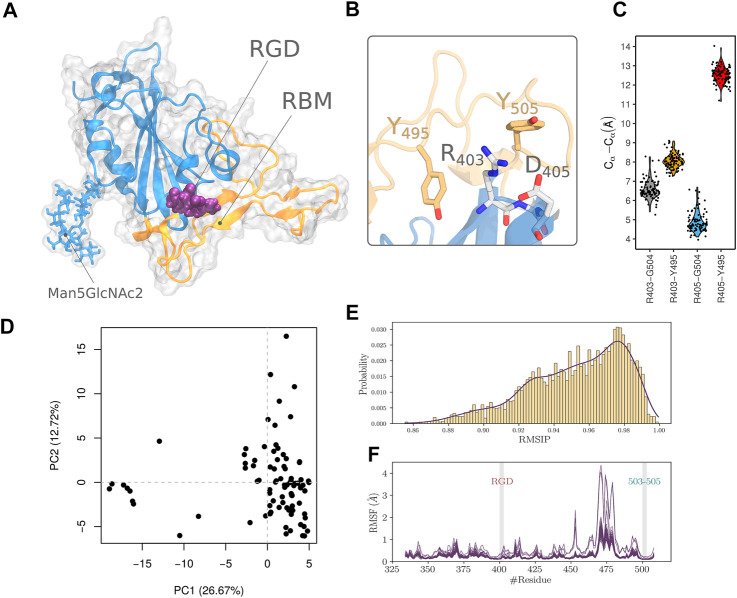
FIGURE 1.
Analysis of the RBD structural ensemble. (A) Structure of RBD showing the RGD motif, the Man5GlcNAc2 polysaccharide and the RBM segment. (B) Arrangement of the RGD motif relative to residue Y505 and Y495. (C) Statistical measurements of distances between RGD residues and D405 and Y495 collected from the ensemble of experimental structures. (D) Projection of RBD structure in the PC1-PC2 subspace of the PCA performed on pre-aligned and superimposed ensemble of structures. (E) RMSIP density plot calculated using the normal modes of each pair of structures of the ensemble. (F) RMSF profile of all the structures in the ensemble computed from all atoms normal mode analysis.

