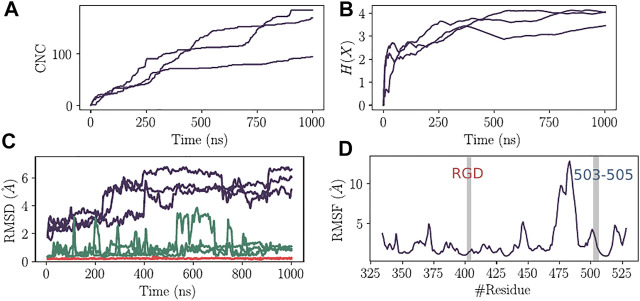
FIGURE 2.
Convergence analysis of aMD and structural deviation of RBD. (A) Cumulative number of clusters as a function of time for the three replicas of aMD trajectories. (B) Evolution of the Shannon’s entropy (H(X)) for the three replicas of aMD trajectories. (C) Root Mean Square Deviation of RBD structure (Purple), C1 cluster of residues (Green) and the RGD motif (Red). (D) Root Mean Square Fluctuation of RBD residues calculated for the C α atoms from the combined aMD trajectories.

