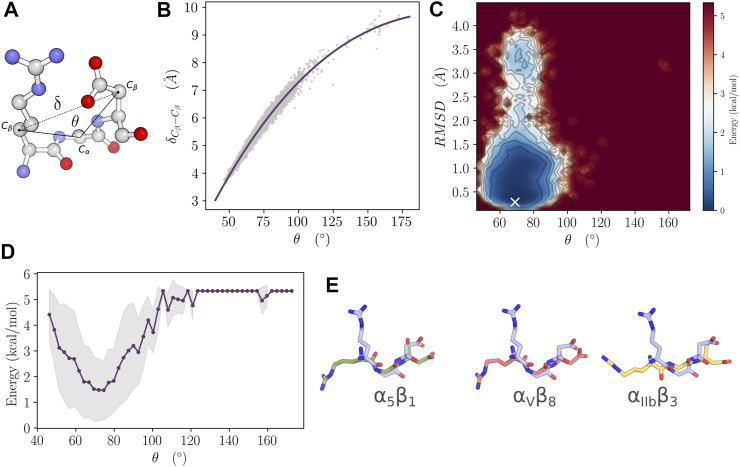
FIGURE 4.
Free energy landscape analysis of the RBD. (A) distance and the θ angle are indicated on the structure of the RGD segment from RBD. (B) Correlation of and θ. Data were fitted to a polynomial model (R 2 = 0.97). (C) Free energy landscape as a function of θ and the RMSD of the C1 residue cluster. The white marker indicates the position of the global minimum. (D) Variation of the energy as a function of θ. The gray shading indicates the boundaries defined by the standard deviation of the energy averaged along the reaction coordinate. (E) The RGD structure corresponding to the minimum of energy (light blue) was fitted and compared to the RGD structure in its bound form with α 5 β 1 (Green), α V β 8 (light pink) and α IIb β 3 (Yellow) integrins.

