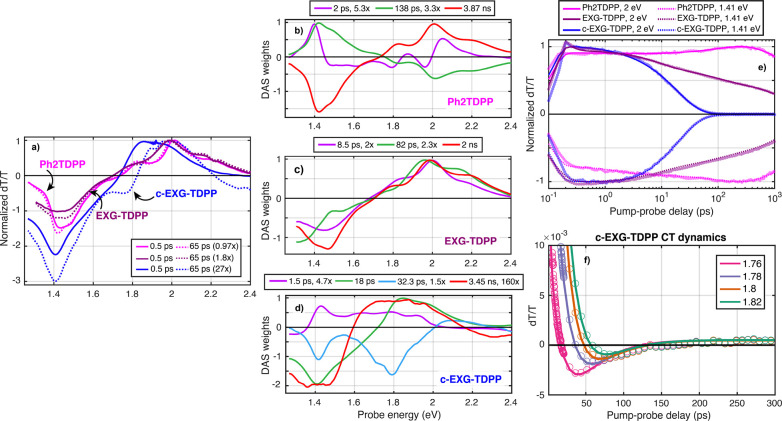
Figure 2.
Transient absorption and global fitting of Ph2TDPP, EXG–TDPP, and c-EXG–TDPP. (a) Comparison of Ph2TDPP (pink), EXG–TDPP (purple), and c-EXG–TDPP (blue) ΔT/T signals at 0.5 ps (solid line) and 65 ps (dashed line). The signals have been multiplied by the factors indicated in the legend for easy comparison between data sets. The Ph2TDPP data set is pumped at 575 nm with 2.3 μW average power, EXG–TDPP is pumped at 565 nm with 70 μW average power, and the c-EXG–TDPP is pumped at 640 nm with 20 μW average power, yielding comparable strength ΔT/T signals at early times. (b, c, d) DAS for Ph2TDPP, EXG–TDPP, and c-EXG–TDPP, respectively. (e) ΔT/T dynamics at energies 1.41 eV (dashed), and 2 eV (solid), with data points indicated by translucent symbols and global analysis fits as solid lines. Each trace is normalized by its maximal absolute value. (f) Charge transfer dynamics in c-EXG–TDPP, with probe energies labeled in the legend. Solid lines are global fit results and empty circles are data points.

