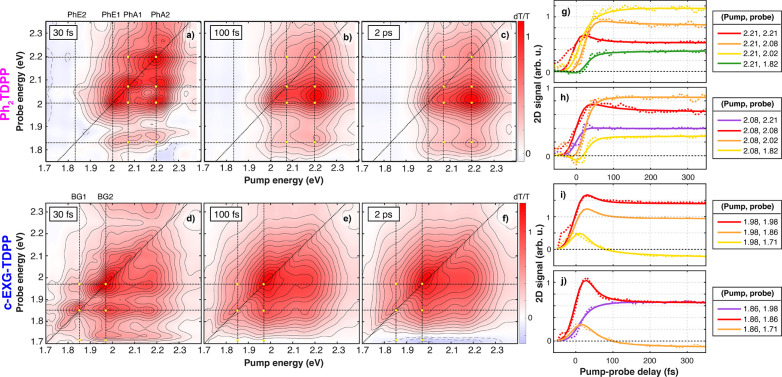
Figure 3.
Selected 2D absorptive spectra for Ph2TDPP and c-EXG–TDPP. (a–f) 2D absorptive maps at 30 (a, d), 100 (b, e), 2000 (c, f) fs for Ph2TDPP (a–c) and c-EXG–TDPP (d–f), with color bar shown in top right (blue for negative, zero is set to white, red for positive ΔT/T). Points of interest are indicated by yellow dots in all maps, which coincide with pumping the linear absorption of Ph2TDPP (PhA1, PhA2), probing the PL of Ph2TDPP (PhE1, PhE2), or pumping/probing the c-EXG–TDPP linear absorption (BG1, BG2) and also probing the c-EXG–TDPP ESA. The corresponding dynamics at those points are shown in panels g–j (g, h for Ph2TDPP, i, j for c-EXG–TDPP). Solid (dashed) contour lines correspond to positive (negative) 2D signals.

