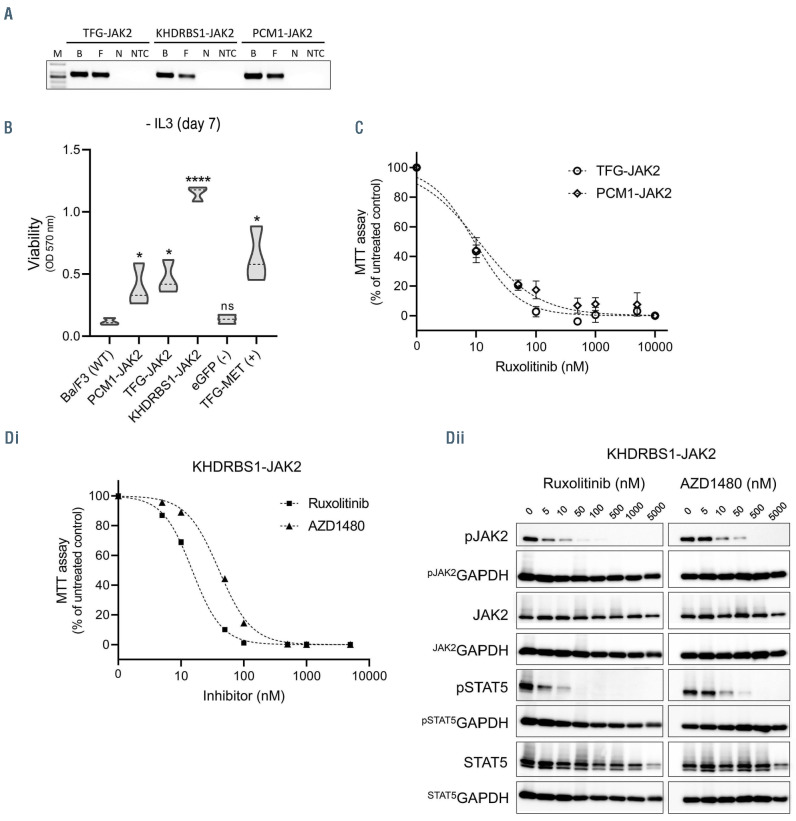
Figure 7.
Oncogenicity validation of JAK2 fusions identified in pcAECyTCL. (A) Expression of JAK2 fusions in transduced Ba/F3 cells was verified by reverse transcriptase polymerase chain reaction. M: molecular-weight marker; B: Fusion DNA in backbone (positive control); F: cDNA from Ba/F3 cells transduced with JAK2 fusion gene; N: cDNA from Ba/F3 cells transduced with eGFP gene (negative control); NTC: non-template control (H2O). (B) Violin plots showing viability of Ba/F3 cells expressing fusion genes KHDRBS1-JAK2, PCM1-JAK2 or TFG-JAK2 seven days after interleukin-3 (IL3) withdrawal (mean OD, n=3). Viability of all cell lines expressing JAK2 fusions was noticeably higher (P<0.05, student’s t-test) compared to wild-type and negative control cells. Control samples: parental Ba/F3 cells (wild-type control), Ba/F3 cells expressing eGFP (negative control), Ba/F3 cells expressing fusion gene TFG-MET (positive control). *P<0.05; ****P<0.0001. (C) Dose-response curves of Ba/F3 cells expressing PCM1-JAK2 (half maximal inhibitory concentration [IC50]=11 nM) or TFG-JAK2 (IC50 =9 nM) when exposed to various concentrations of JAK1/2 inhibitor ruxolitinib (mean OD; error bars, standard deviation [SD], n=3). (D) Validation experiments with JAK2 fusion containing novel kinase fusion partner KHDRBS1. (i) Dose-response curves of Ba/F3 cells expressing KHDRBS1-JAK2 when exposed to various concentrations of JAK1/2 inhibitors ruxolitinib (IC50=15 nM) or AZD1480 (IC50=40 nM) (mean OD; error bars, SD, n=3). (ii) Western blot analysis of Ba/F3 cells expressing KHDRBS1-JAK2 showed a dose-response reduction in phosphorylation of JAK2 and STAT5 with increasing concentrations of ruxolitinib or AZD1480.

