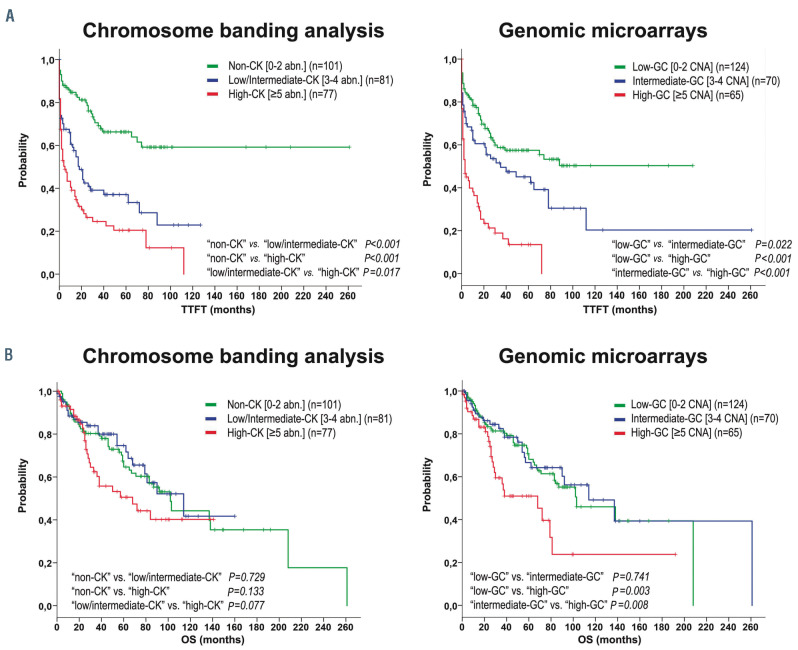
Figure 2.
Kaplan-Meier plots for time to first treatment and overall survival based on genomic complexity stratification assessed by chromosome banding analysis and genomic microarrays. Kaplan-Meier estimation for time to first treatment (TTFT) (A) and overall survival (OS) (B) in patients classified in each category based on total number of aberrations found by chromosome banding analysis (CBA): non-complex karyotype (non-CK) (0-2 abnormalities [abn.]), low/intermediate-CK (3-4 abn.) or high-CK (≥5 abn.) (plots on the left) and based on total number of copy number aberrations (CNA) detected by genomic microarrays (GM): low-genomic complexity (GC) (0-2 CNA), intermediate-GC (3-4 CNA) or high-GC (≥5 CNA)] (plots on the right).

