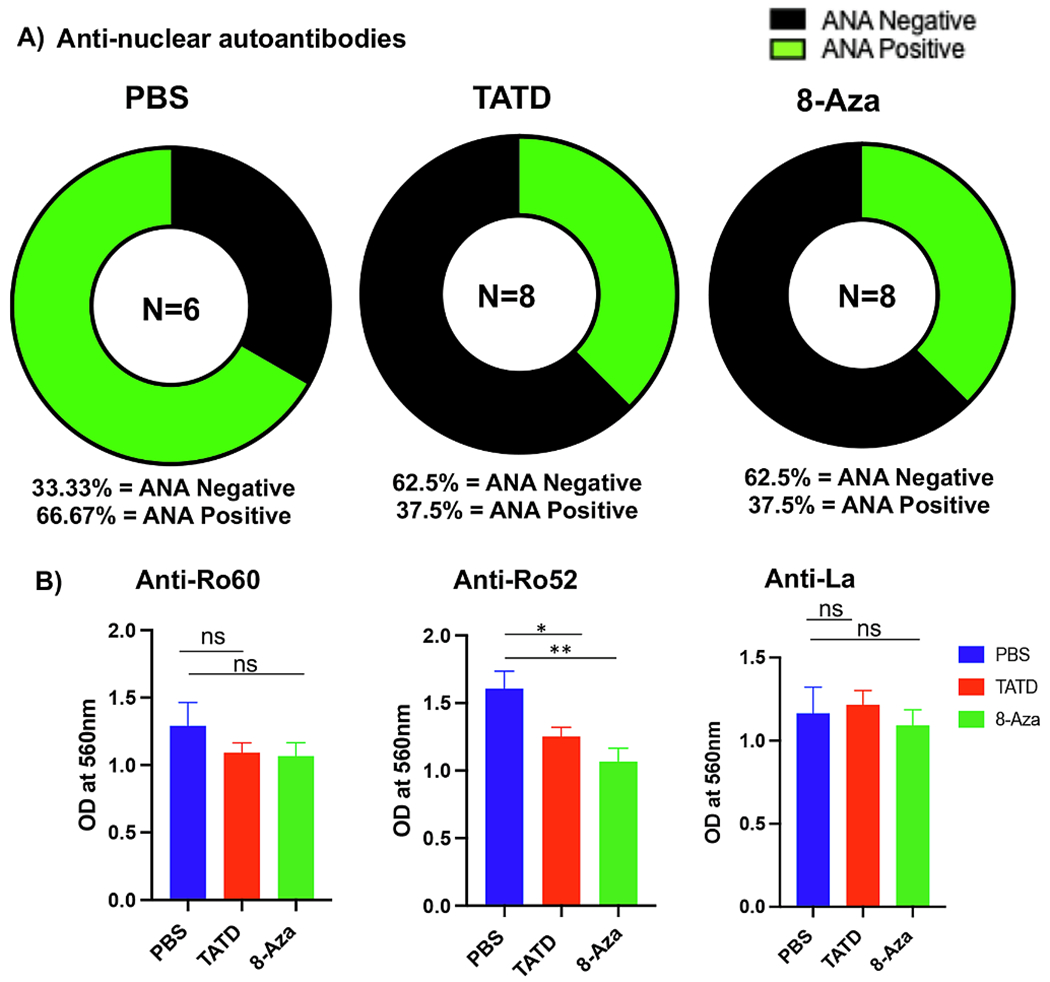
Fig. 3.

TATD and 8-Aza reduced autoantibodies in the NOD mice. A) ANA staining using HEp2 cells with TATD- (n = 8), 8-Aza- (n = 8), and PBS-treated (n = 6). The circular graphs displayed the frequency of animals with ANA negative or positive. B) Autoantibodies against Ro60, Ro52, and La were determined using ELISA. The statistical differences between control and drug-injected mice were determined using a one-way ANOVA with an uncorrected Fisher’s LSD test at all threshold events. Error bars indicate with 95% class interval confidence, *: p < 0.0332, **: p < 0.0021, NS, not significant.
