Fig. 1.
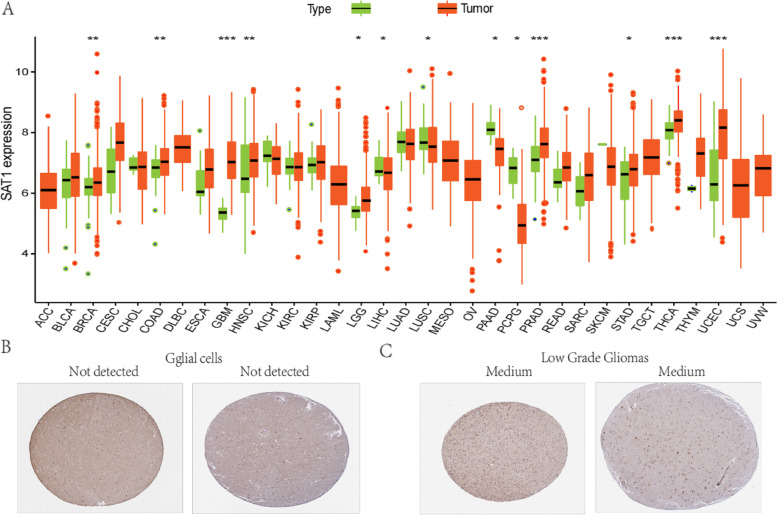
SAT1 expression levels in 33 different types of cancers from TCGA database. Green and orange respectively represent normal and tumor (*P < 0.05, **P < 0.01, ***P < 0.001) (A). In normal brain cortex tissues, SAT1 protein was not detectable in glial cells (B). LGG cases presented with a medium level of SAT1 staining (C). (Adrenocortical carcinoma (ACC), bladder urothelial carcinoma (BLCA), breast invasive carcinoma (BRCA), cervical squamous cell carcinoma and endocervical adenocarcinoma (CESC), cholangiocarcinoma (CHOL), colon adenocarcinoma (COAD), lymphoid neoplasm diffuse large B-cell lymphoma (DLBC), esophageal carcinoma (ESCA), glioblastoma multiform (GBM), head and neck squamous cell carcinoma (HNSC), kidney chromophobe (KICH), kidney renal clear cell carcinoma (KIRC), kidney renal papillary cell carcinoma (KIRP), acute myeloid leukemia (LAML), liver hepatocellular carcinoma (LIHC), lung adenocarcinom (LUAD), lung squamous cell carcinoma (LUSC), mesothelioma (MESO), ovarian serous cystadenocarcinoma (OV), pancreatic adenocarcinoma (PAAD), pheochromocytoma and paraganglioma (PCPG), prostate adenocarcinoma (PRAD), rectum adenocarcinom (READ), sarcoma (SARC), skin cutaneous melanoma (SKCM), stomach adenocarcinoma(STAD), testicular germ cell tumors (TGCT), thyroid carcinoma (THCA), thymoma (THYM), uterine corpus endometrial carcinoma (UCEC), uterine carcinosarcoma (UCS), uveal melanoma (UVW)

