
Figure 3: Percentage of rotavirus tests with positive results for the different weeks of the year starting in July and finishing in June, USA, 2000–15.
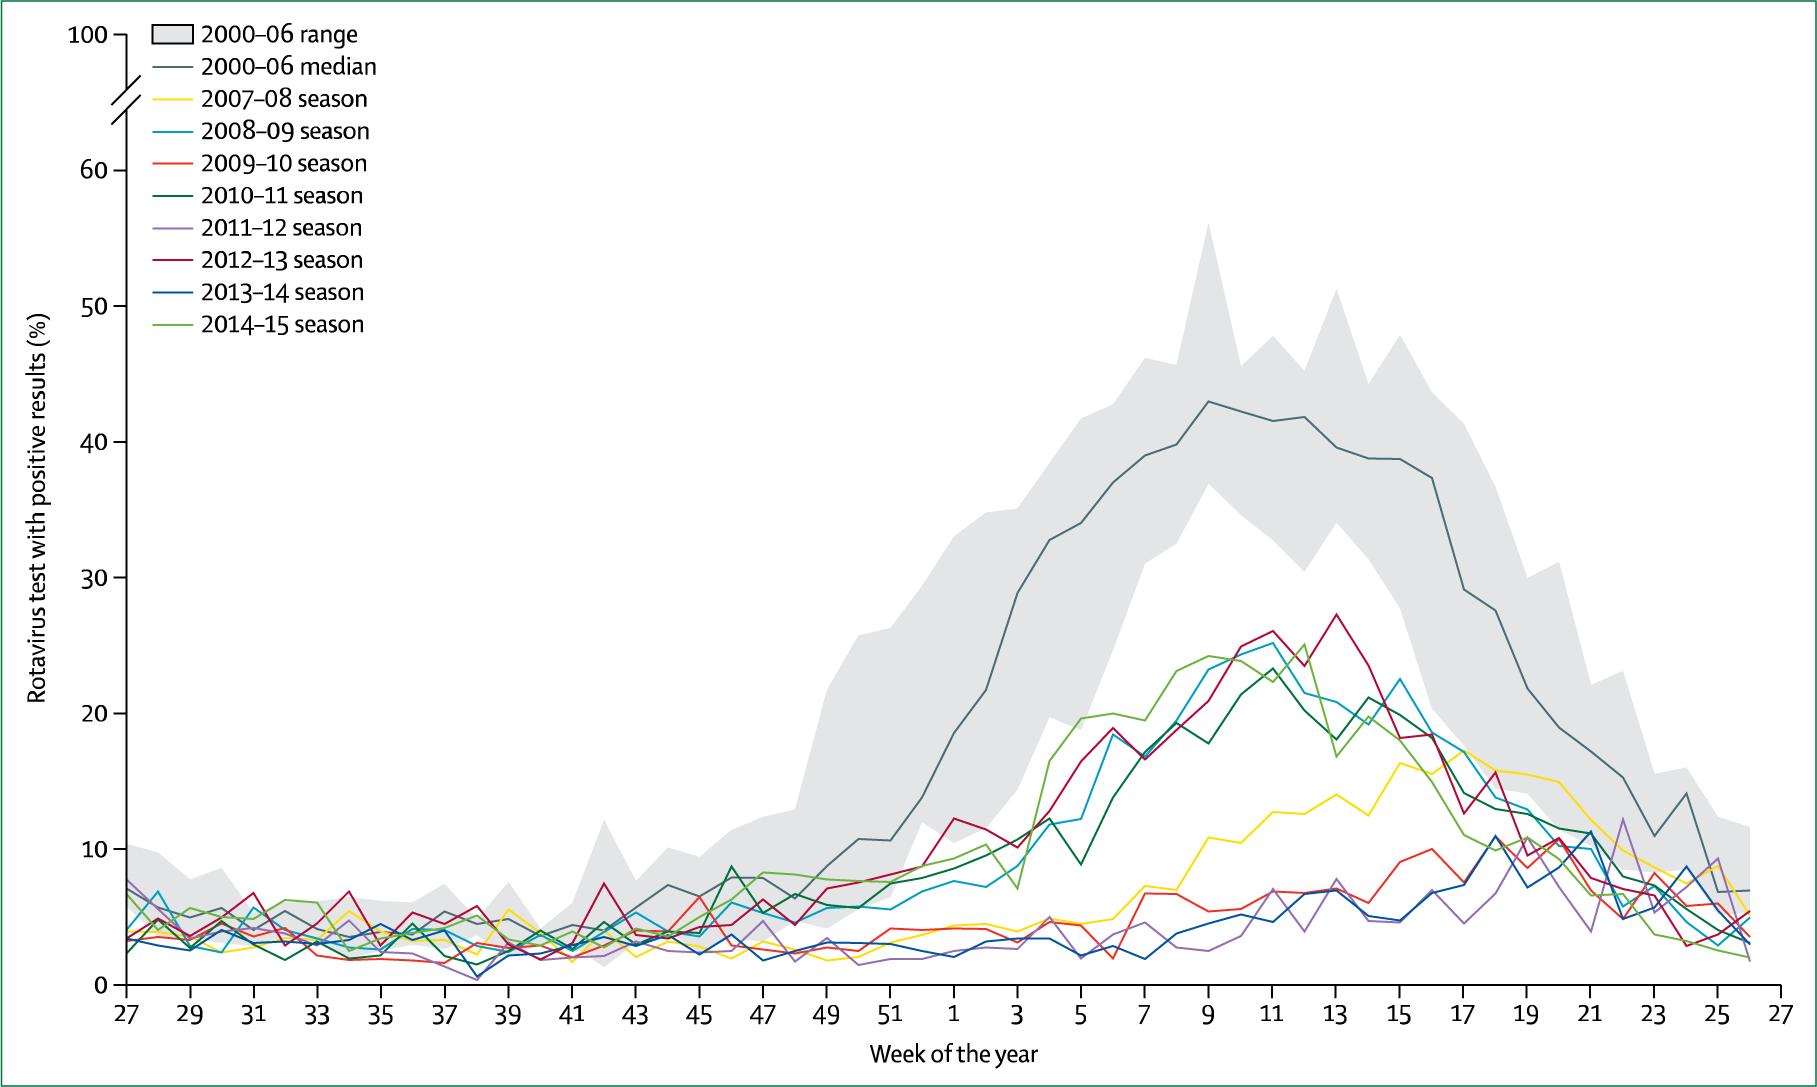
The maximum and minimum percentage of rotavirus-positive tests for 2000–06 could have occurred during any of these six baseline seasons. Since the introduction of a rotavirus vaccine in the USA, epidemics have occurred every other year (ie, 2008–09, 2010–11, 2012–13, and 2014–15). Data were obtained from the US Centers for Disease Control and Prevention National Respiratory and Enteric Virus Surveillance System.113