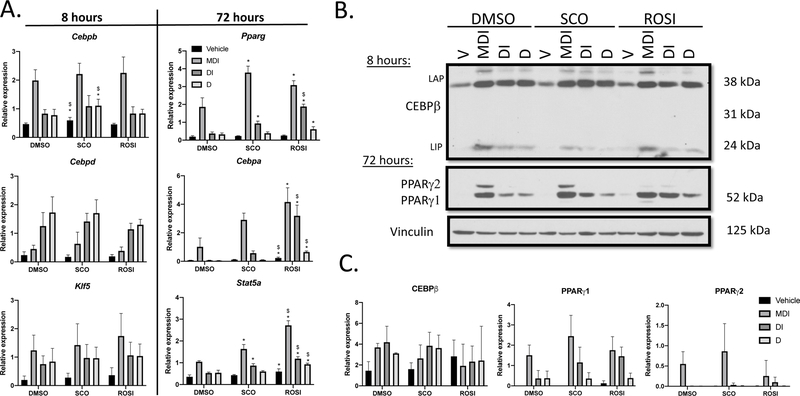
Figure 2: SCO and ROSI enhance expression of late stage adipogenic markers.
3T3-L1 preadipocytes were induced to differentiate and treated as described in Figure 1A. (A) Cells were lysed at 8 hours (n=3) and 72 hours (n=3) to assess mRNA expression of adipogenic genes. Quantification was determined by qPCR using the standard curve method and transcript expression is presented relative to Nono. (B) Whole cell extracts were collected at 8 hours and 72 hours and subjected to western blots analysis. (C) Bands were imaged on film using the ECL method and quantified and normalized to vinculin using the Image Studio Lite software. The results shown are representative of three independent experiments. Data are presented as mean ± SD. Statistical analyses were performed using a one-way ANOVA with multiple comparisons, significance was set at p<0.05. * indicates significance compared to DMSO; $ indicates significance between SCO and ROSI.

