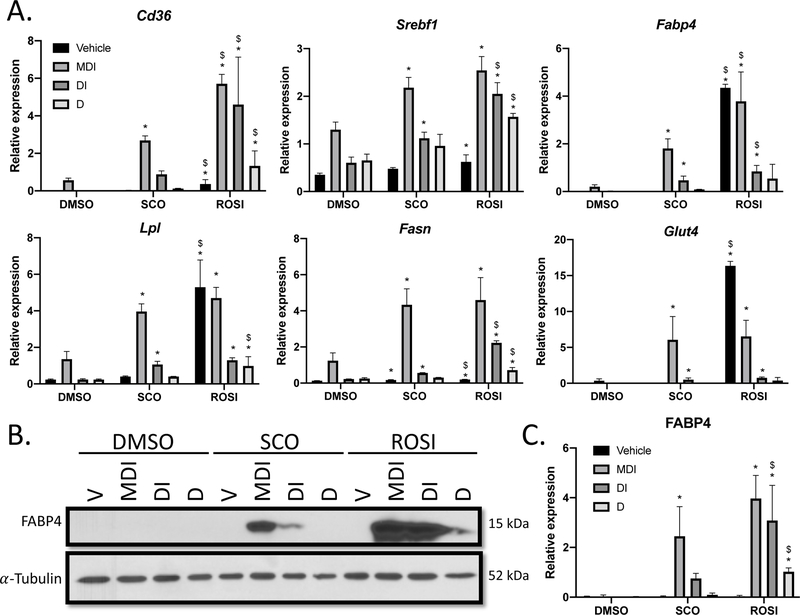
Figure 3: SCO promotes expression of PPARγ target genes in the absence of MIX.
3T3-L1 preadipocytes were induced and treated as described in Figure 1A. (A) Cell monolayers were harvested at 72 hours (n=3) examine mRNA expression of genes involved in lipid accumulation. Quantification was determined by qPCR using the standard curve method and transcript expression is presented relative to Nono. (B) Whole cell extracts were collected at 72 hours and subject to western blot analysis. (C) FABP4 expression was quantified and normalized using a-Tubulin expression with use of Image Studio Lite software. This experiment is a representative of an experiment independently performed three times on different batches of cells. Data are presented as mean ± SD. Statistical analyses were performed using a one-way ANOVA with multiple comparisons, significance was set at p<0.05. * indicates significance compared to DMSO; $ indicates significance between SCO and ROSI.

