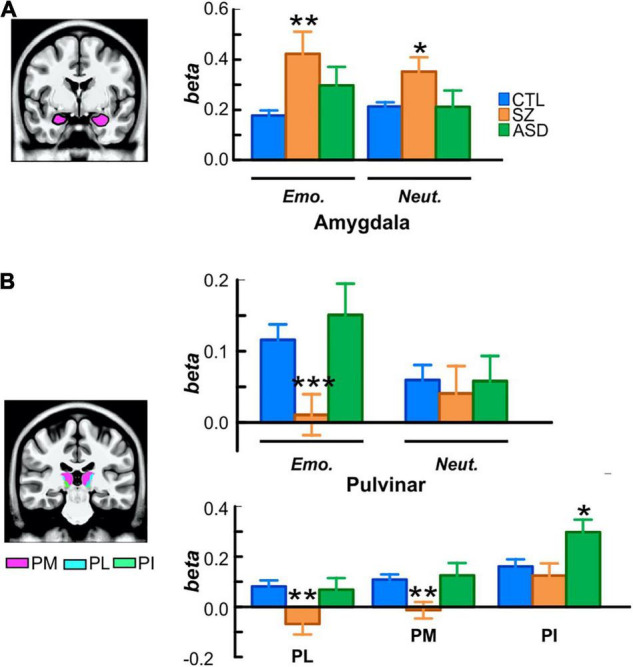
FIGURE 4.

(A) Localization and activation of the amygdala in each participant group, superimposed on an MNI template volume. (B) Localization of the medial (pink; PM), lateral (cyan; PL), and inferior (green, PI) subdivisions of pulvinar. For each group, bar plots (top) are of beta values for emotional and neutral faces extracted from the whole pulvinar and (bottom) of mean betas from each subdivision. *p < 0.05; **p < 0.01; ***p < 0.001.
