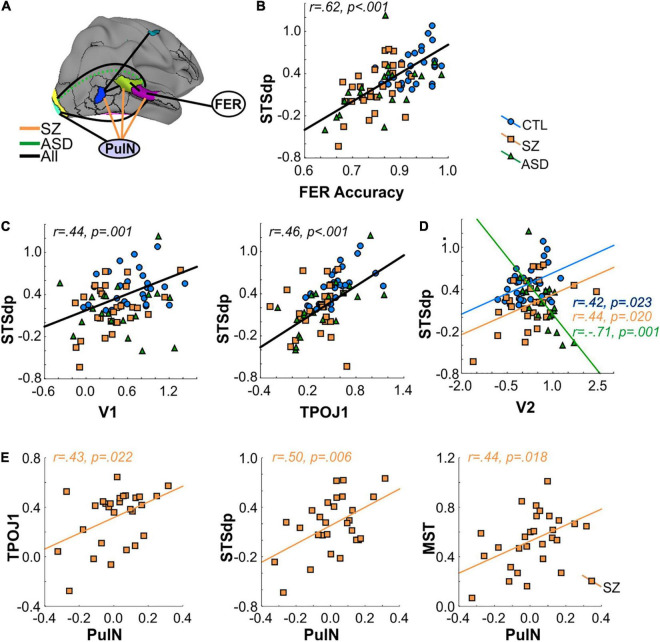
FIGURE 5.
(A) Interrelationship between activated cortical regions, pulvinar (PulN) activation and face-emotion recognition (FER) accuracy. Black lines denote a significant relationship across all groups. Orange lines denote significant relationship only in SZ group. Dashed green line denotes a significant (negative) correlation in ASD group only. (B) Correlation between FER accuracy and mean activation (beta) of the STSdp parcel. In all cases, black regression lines signify the correlation was significant across groups. (C) Correlation between STSdp-V1 and STSdp-TPOJ1 activation. (D) Correlation between STSdp-V2 activation. In ASD participants, enhanced V2 was associated with reduced STSdp activation. The opposite relationship was obtained in SZ and CTL groups. (E) Scatterplots showing a significant and positive correlation between PulN activation and TPOJ1 (left), STSdp (center) and MST (right) in the SZ group alone.

