
Figure 3.
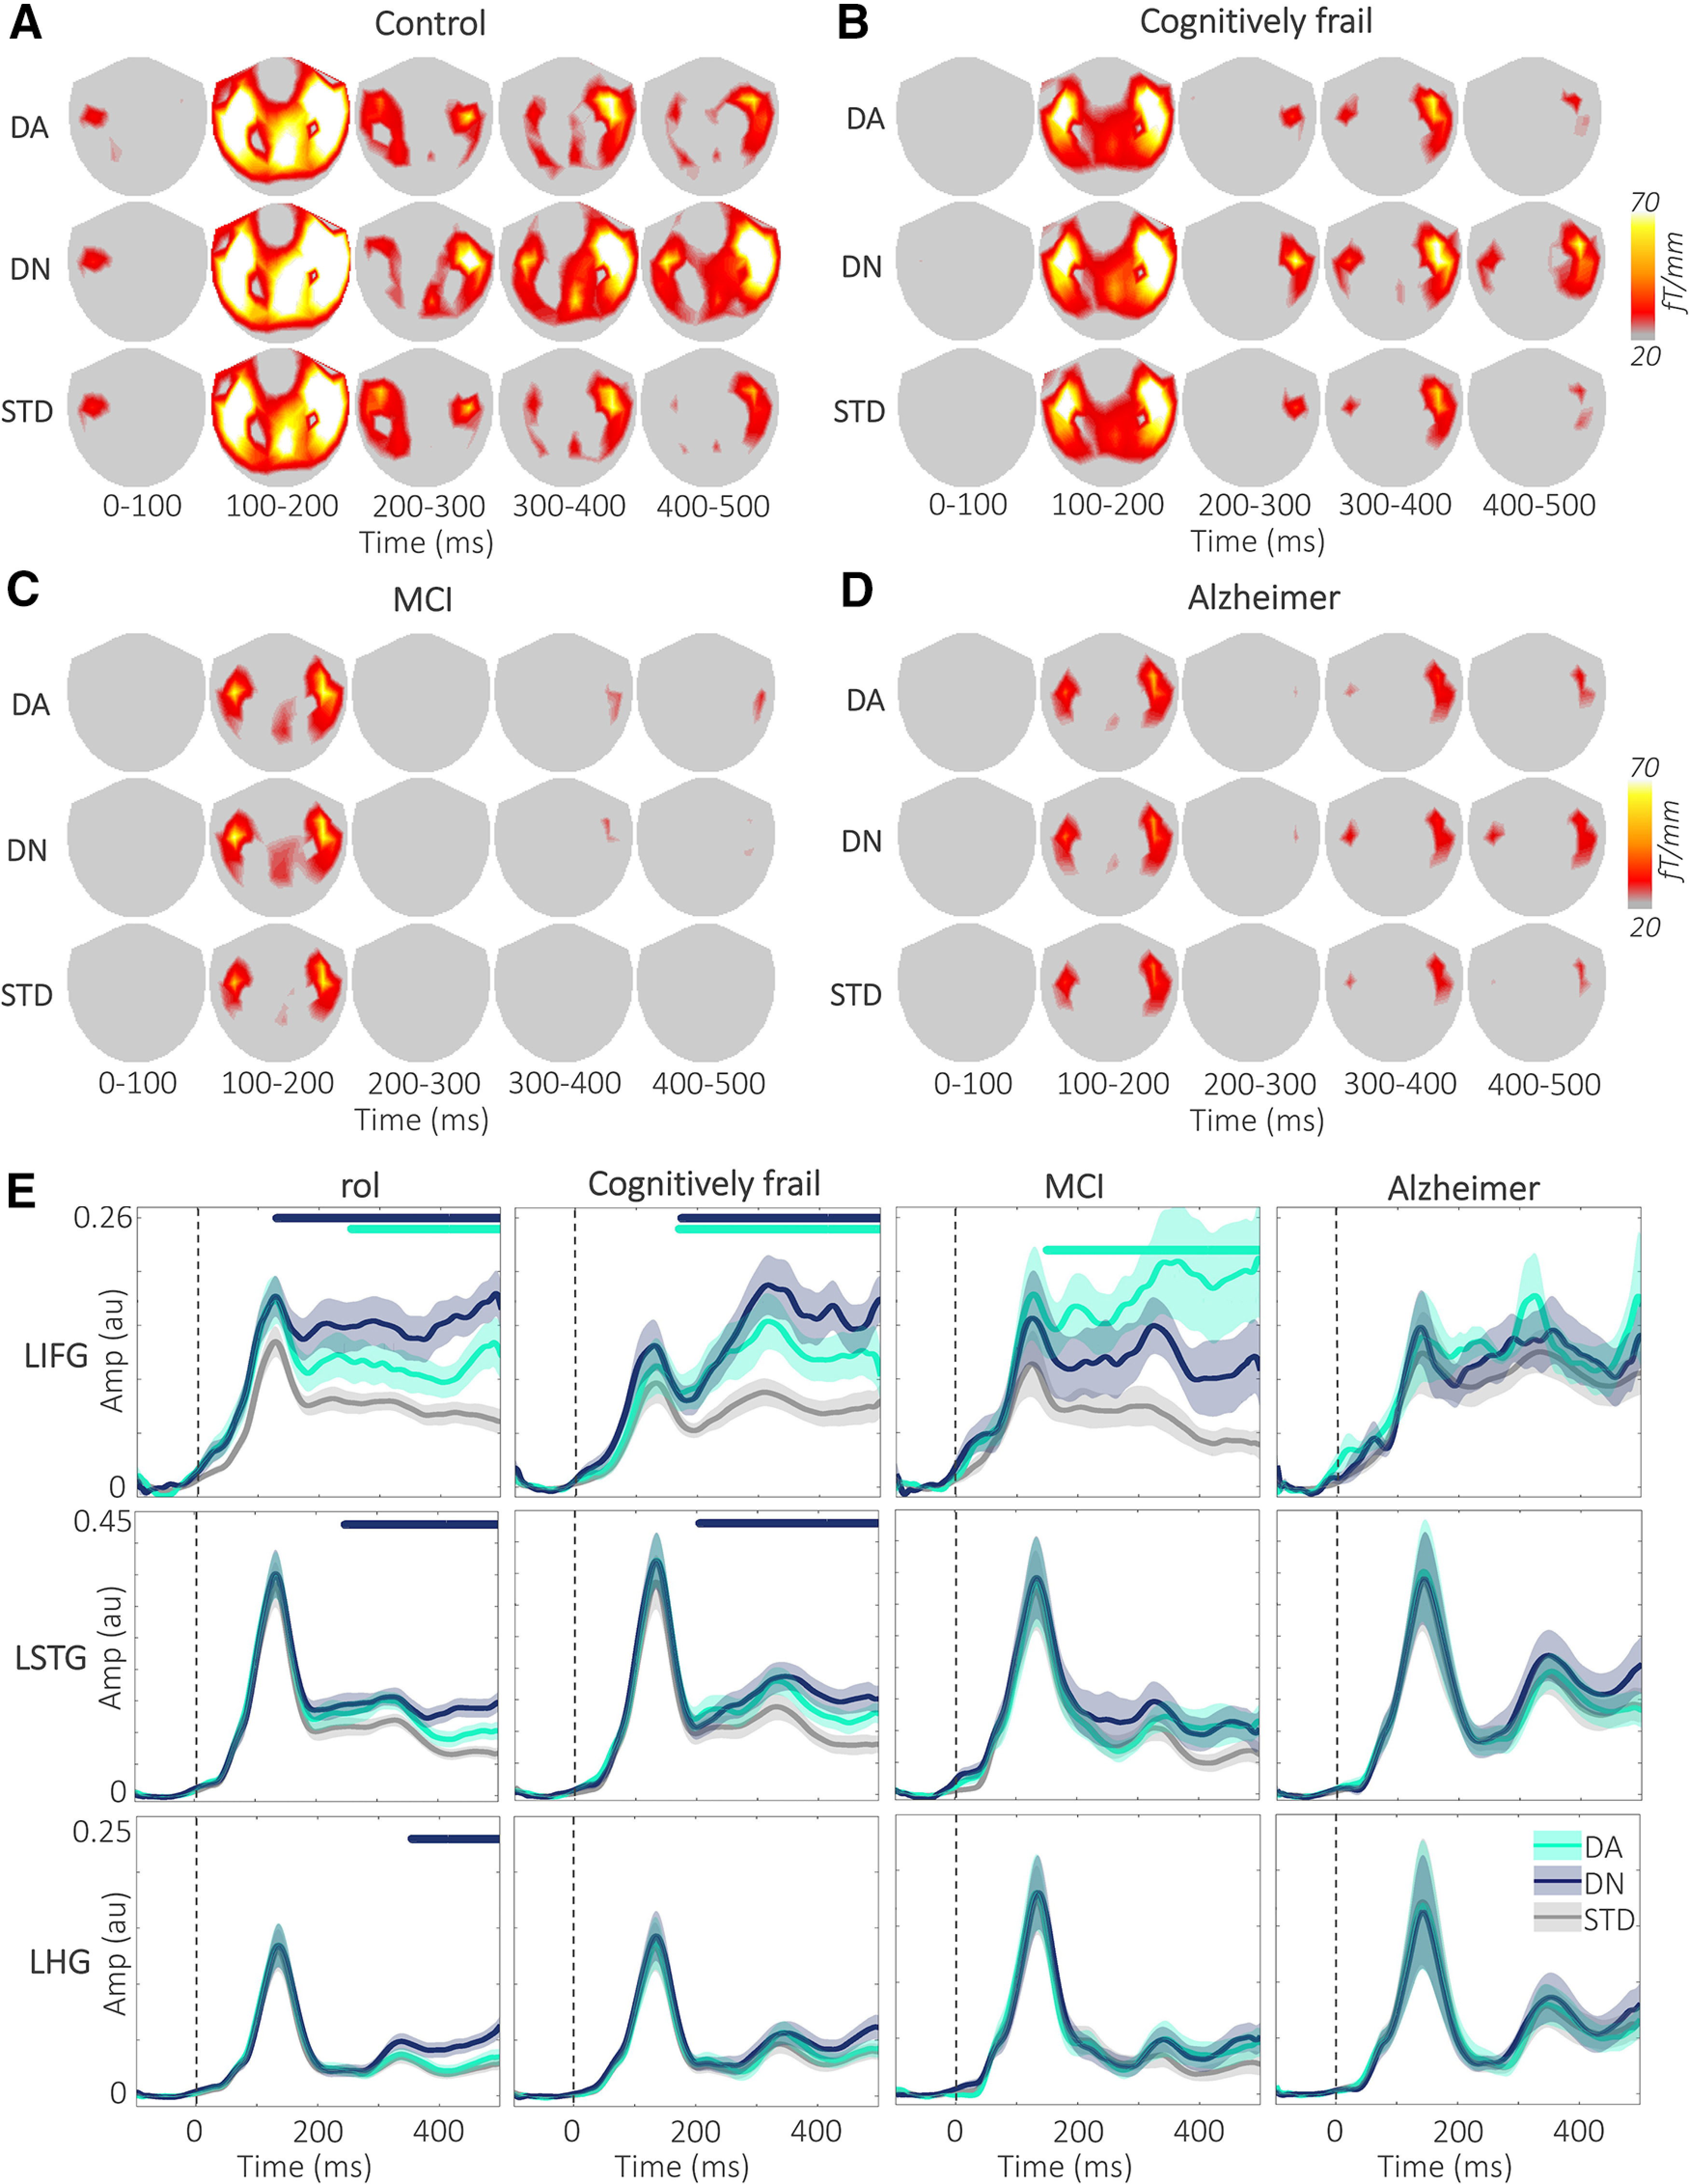
DA and DN responses by group. A-D, Topoplots represent the mean gradiometer activity across the scalp for the DA, DN, and STD conditions in 100 ms time windows in four groups. The DN amplitude is higher after the N100 peak, compared with both DA and STD conditions in control and cognitively frail groups. The gradiometer activity in the MCI and Alzheimer's disease groups is weaker compared with the control and cognitively frail groups. E, Plots represent the RMS time series for the left hemisphere ROIs for simplicity. Dashed vertical lines indicate the sound onset. The amplitude differences between the deviants and the STD in the frontal regions were larger than the temporal regions, and the deviant effects are stronger in the control and cognitively frail groups; and there is considerably higher variance in the MCI group. For the renderings of the source activity, see Extended Data Figure 3-1. Amp, Amplitude; AU, arbitrary units; fT, femtotesla; LHG, left HG; LIFG, left IFG; LSTG, left STG.