Figure 5.

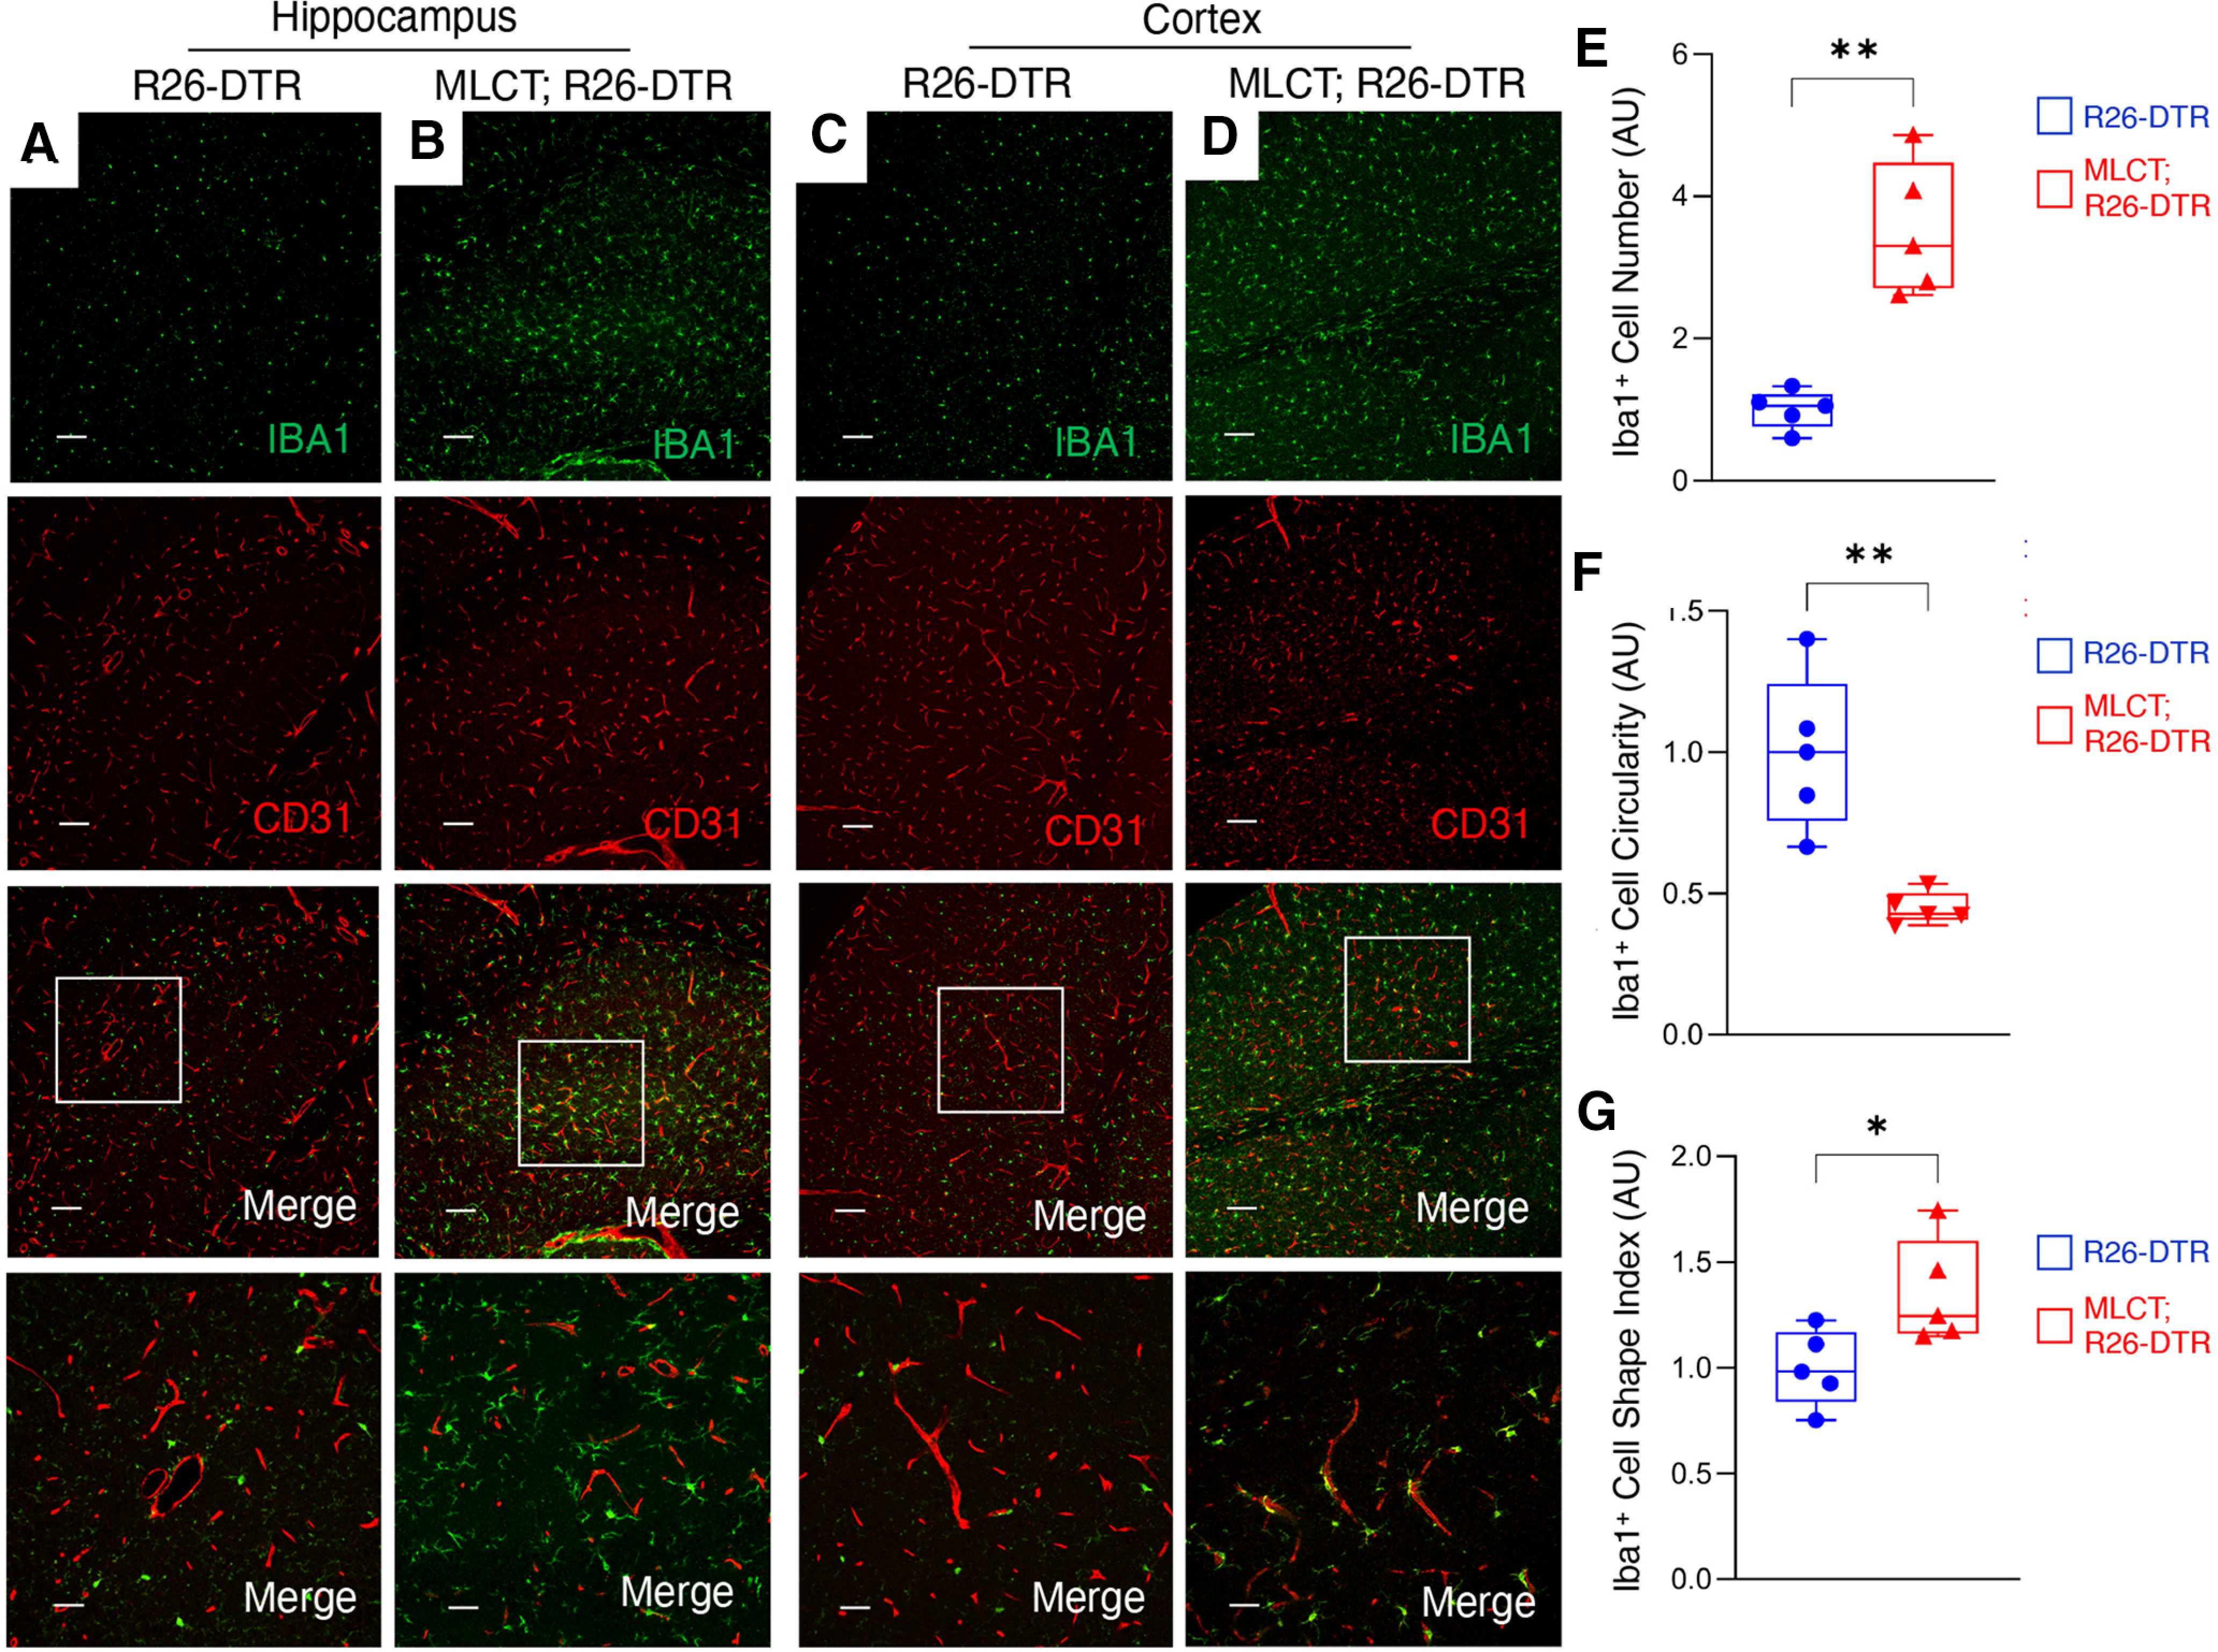
Microgliosis in response to BBB disruption. A–D, Immunofluorescence analysis of P60 coronal sections from one R26-DTR control (A) and a MLCT;R26-DTR mutant brain (B) labeled with antibodies directed against Iba1 (green) and CD31 (red). Shown are representative images from the hippocampus (A,B) and cerebral cortex (C,D). In brain regions from the control mouse (A,C), there is regular distribution of Iba1-expressing microglia, whereas there is robust perivascular microgliosis in the mutant brains (B,D), and particularly in cortical regions. E–G, Quantitation of microglial activation in the R26-DTR control cortex and MLCT;R26-DTR mutant cortex as measured by Iba1+ cell number (E), circularity (F), and shape index (G). Differences between groups (E–G) were analyzed using Student's t test (n = 3). Data are mean ± SEM. *p < 0.05. **p < 0.01.
